A compass-and-straightedge (and hard probability theory) puzzle
Draft of 2019.01.01
May include: games ↘ geometry ↗ &c.
It’s a new year, here. Maybe there’s a kick in the ass for me, to write more accumulated stuff I think you’ll enjoy, and hoard less of it for “when it’s done”.
This one is a puzzle, or a mathematical recreation, or a hard question in combinatorics, plane geometry and probability theory. Or all of those. I have a feeling it’s one of those open-ended things you could write a “quick” program to explore to your satisfaction, or write a Master’s thesis about.
It’s got “the stuff”, in other words.
Compasses and straight edges
Suppose I give you \(N\) points in general position in the plane. In this case, I mean none of them are coincident.
You will recall that in compass and straightedge constructions, you can use points in a plane, and the two “tools” you are given, to construct “figures”.
With the straightedge, you can do one thing only: Pick any pair of (not-coincident) points, and draw an infinite line passing through those two points. You can’t measure, you can’t draw a line that isn’t defined by existing points, you can’t whack your neighbor on the head. You use an existing pair of points, and you get a new line.
With the compass[es], you can do one thing only: Pick any pair of (not-coincident) points, and draw a circle using one point as the center, and the other point as the starting/endpoint of the circumference. You can’t measure, you can’t make a fake measuring tool by “moving” the compass after setting up the angle, you can’t draw a circle through three points (on purpose) or any of those other things you might want to do. You use an existing pair of points, and you get one new circle.
Here are some things you do get, though: You don’t have to ever draw the same line or circle twice. You don’t have to worry about whether a line or circle you’re already drawing passes through any other points—“we” (the algorithm runner) will tell you that “for free”. So if by chance a new line goes through a third point, you’ll know. If by chance you draw a second circle, using new points, that happens to be coincident with a prior circle, you’ll also know.
OK?
So I’ve given you \(N\) points. Call them \(A\) and \(B\) and \(C\) for now.
Now I want you to draw all possible lines and circles using those three points. That’ll be three lines (\(\overleftrightarrow{AB}\), \(\overleftrightarrow{AC}\) and \(\overleftrightarrow{BC}\)), and (up to) six circles (those with radii \(\overrightarrow{AB}\), \(\overrightarrow{BA}\), \(\overrightarrow{AC}\), \(\overrightarrow{CA}\), \(\overrightarrow{BC}\), and \(\overrightarrow{CB}\)). Some of those circles will be coincident if you’ve drawn an isosceles triangle, but you can make six if you wiggle your points around a bit and avoid overlaps.
At this point you should have a diagram that looks a bit like this one I made with GeoGebra:
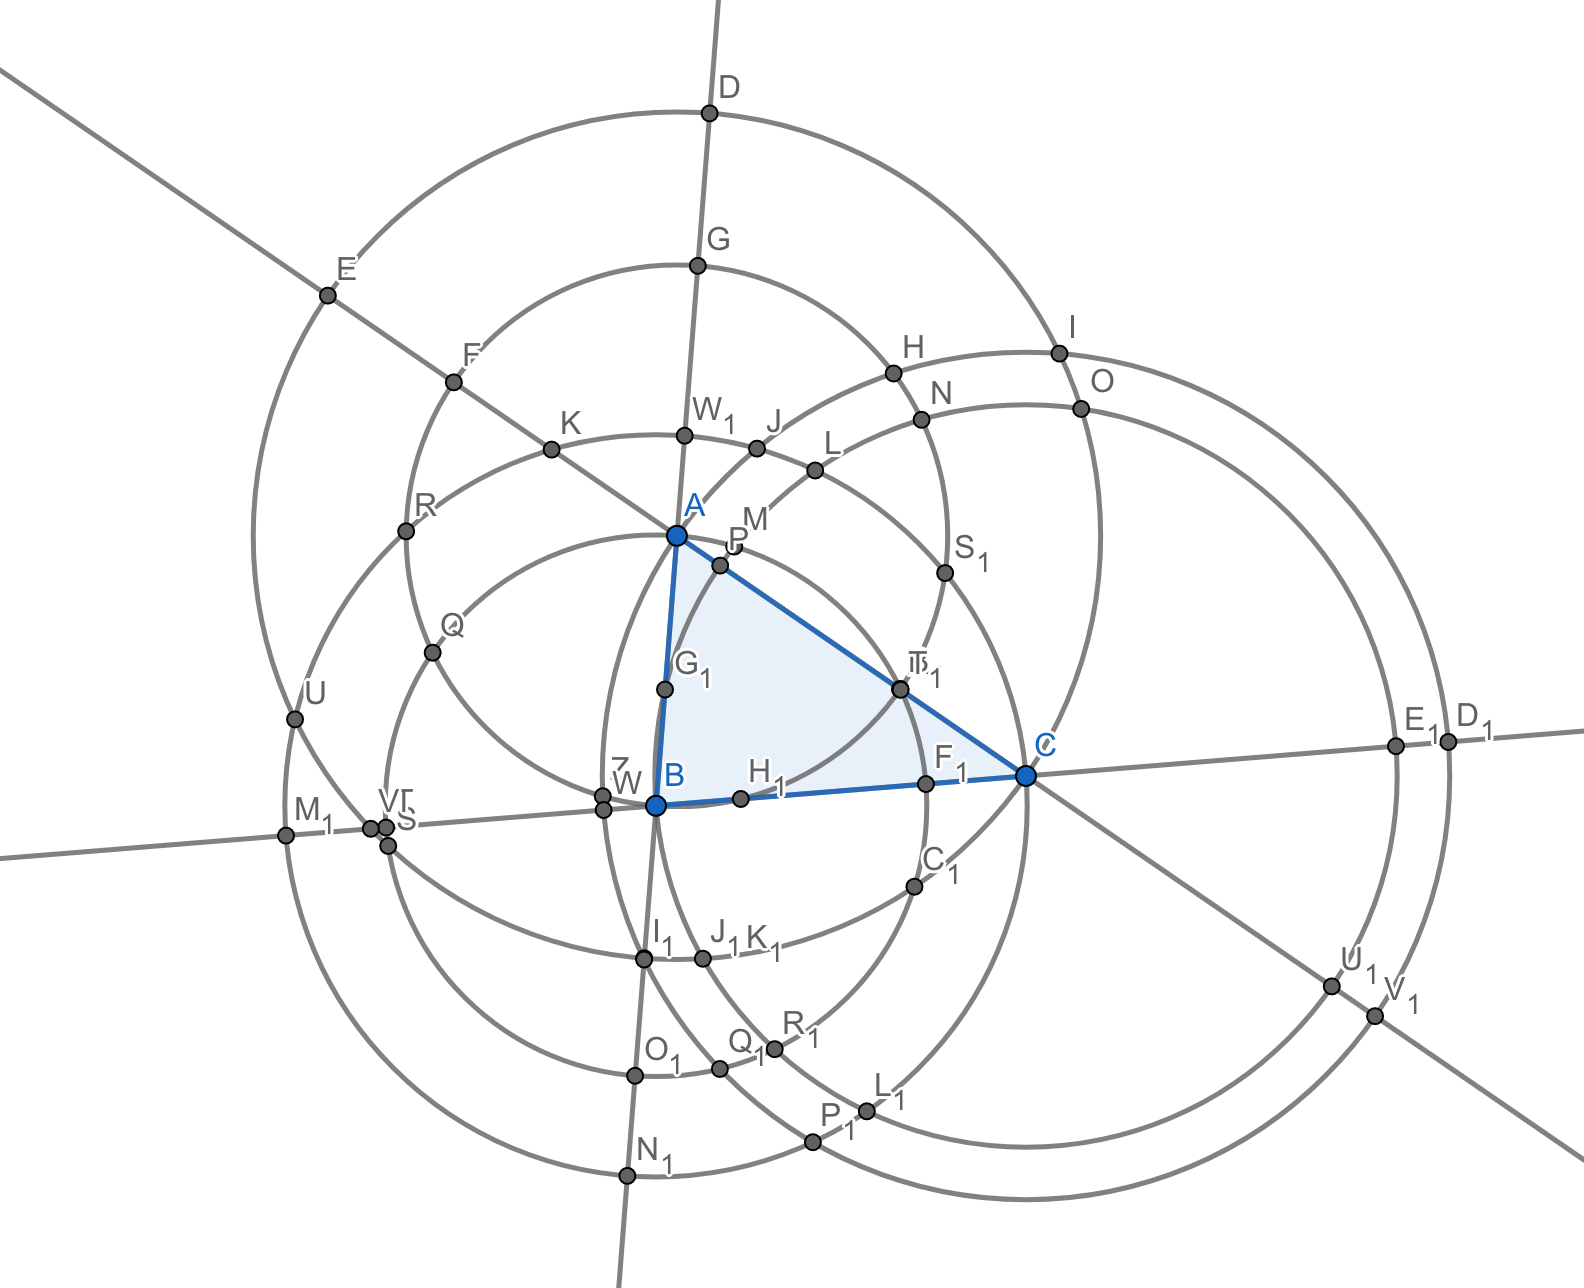
Can you see that I’ve also labeled the points of intersection of the six circles and three lines? I did it manually for the sake of this diagram, and it’s an informative bit of embodied learning to try making sure they’re all there by being very careful, but maybe you shouldn’t get caught up in counting them or anything. What I’m trying to say is: this was hard enough that I already wanted to write a program to do this for me, and I had to be extra careful to move the points \(A\), \(B\) and \(C\) around to ensure the circles didn’t overlap, while they also seemed to intersect all the things they possibly could intersect.
Because I want you to find all of these intersections. Regardless of whether I managed to do so in my diagram (and I think I missed a couple), the task here today is to find all of the intersections of the three lines and six circles constructed using \(A\) and \(B\) and \(C\).
Here is (most of?) the collection of points in this first round of intersection-finding, starting from the three points I’ve indicated as \(A\) and \(B\) and \(C\) above, and looking at all the places the three lines and six circles intersect:
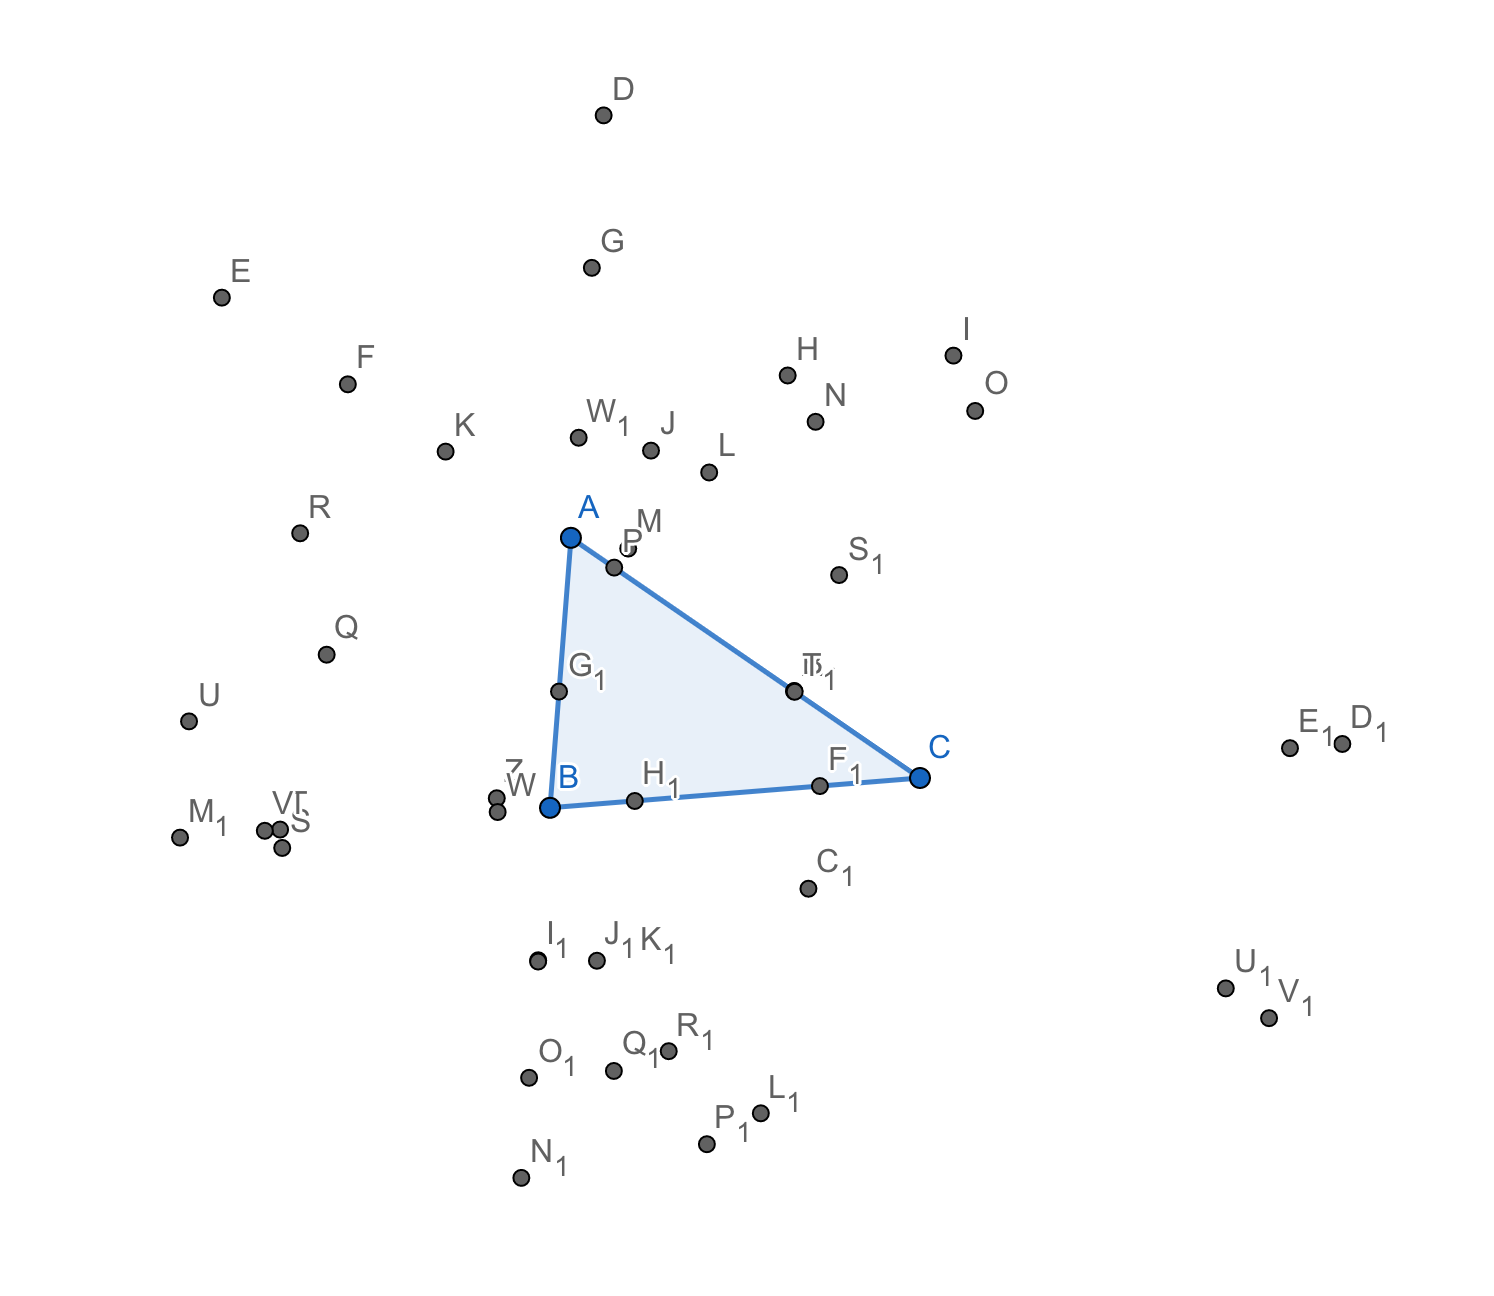
Again, for certain arrangements of the first three points, not all of these intersections may exist. Indeed, looking over this picture after making it, I see two intersections on two of the sides of the triangle, but only one on another, so I probably missed something. Sometimes the circles and the lines just don’t all cross each other the maximum number of times. Keep that in mind….
Clouds of points
You know where I’m going, right?
We’ve “initialized” a recursive system here, with the three (more generally \(N_0\)) initial points.
That set of \(N_0\) points can be broken down into pairs, and used as arguments for the “line figure” and “circle figure” functions. Those produce… well, you know, figures on the plane: lines and circles.
Then I’ve used some kind of “set of intersections” function—manual, so far, but as I said, I regret that decision already—on the collection of nine figures, and produced the set of… I dunno, lemme count ’em… \(44\) new intersection points. I then combine the set of initial points with the set of new intersection points… and repeat.
Yup.
So now we have (on the order of) 47 points, and I want to repeat the recursive process again. I want to draw all possible lines and circles using those 47 points; something on the order of \((47\times 46)-3=2159\) new lines, and \(47^2-6=2203\) new circles. Also known as a “shit-ton” or “pantload” of figures.
Just to see if I could even do a fraction of this by hand, I tried to draw the circles (not even the lines) centered at point \(A\) and passing through the new intersection points I collected in the first stage. This is a (probably wrong) diagram I produced, after wiggling the positions of \(A\) and \(B\) and \(C\) around in an attempt to distinguish points that already fall on existing circles, from those that happen to be close:
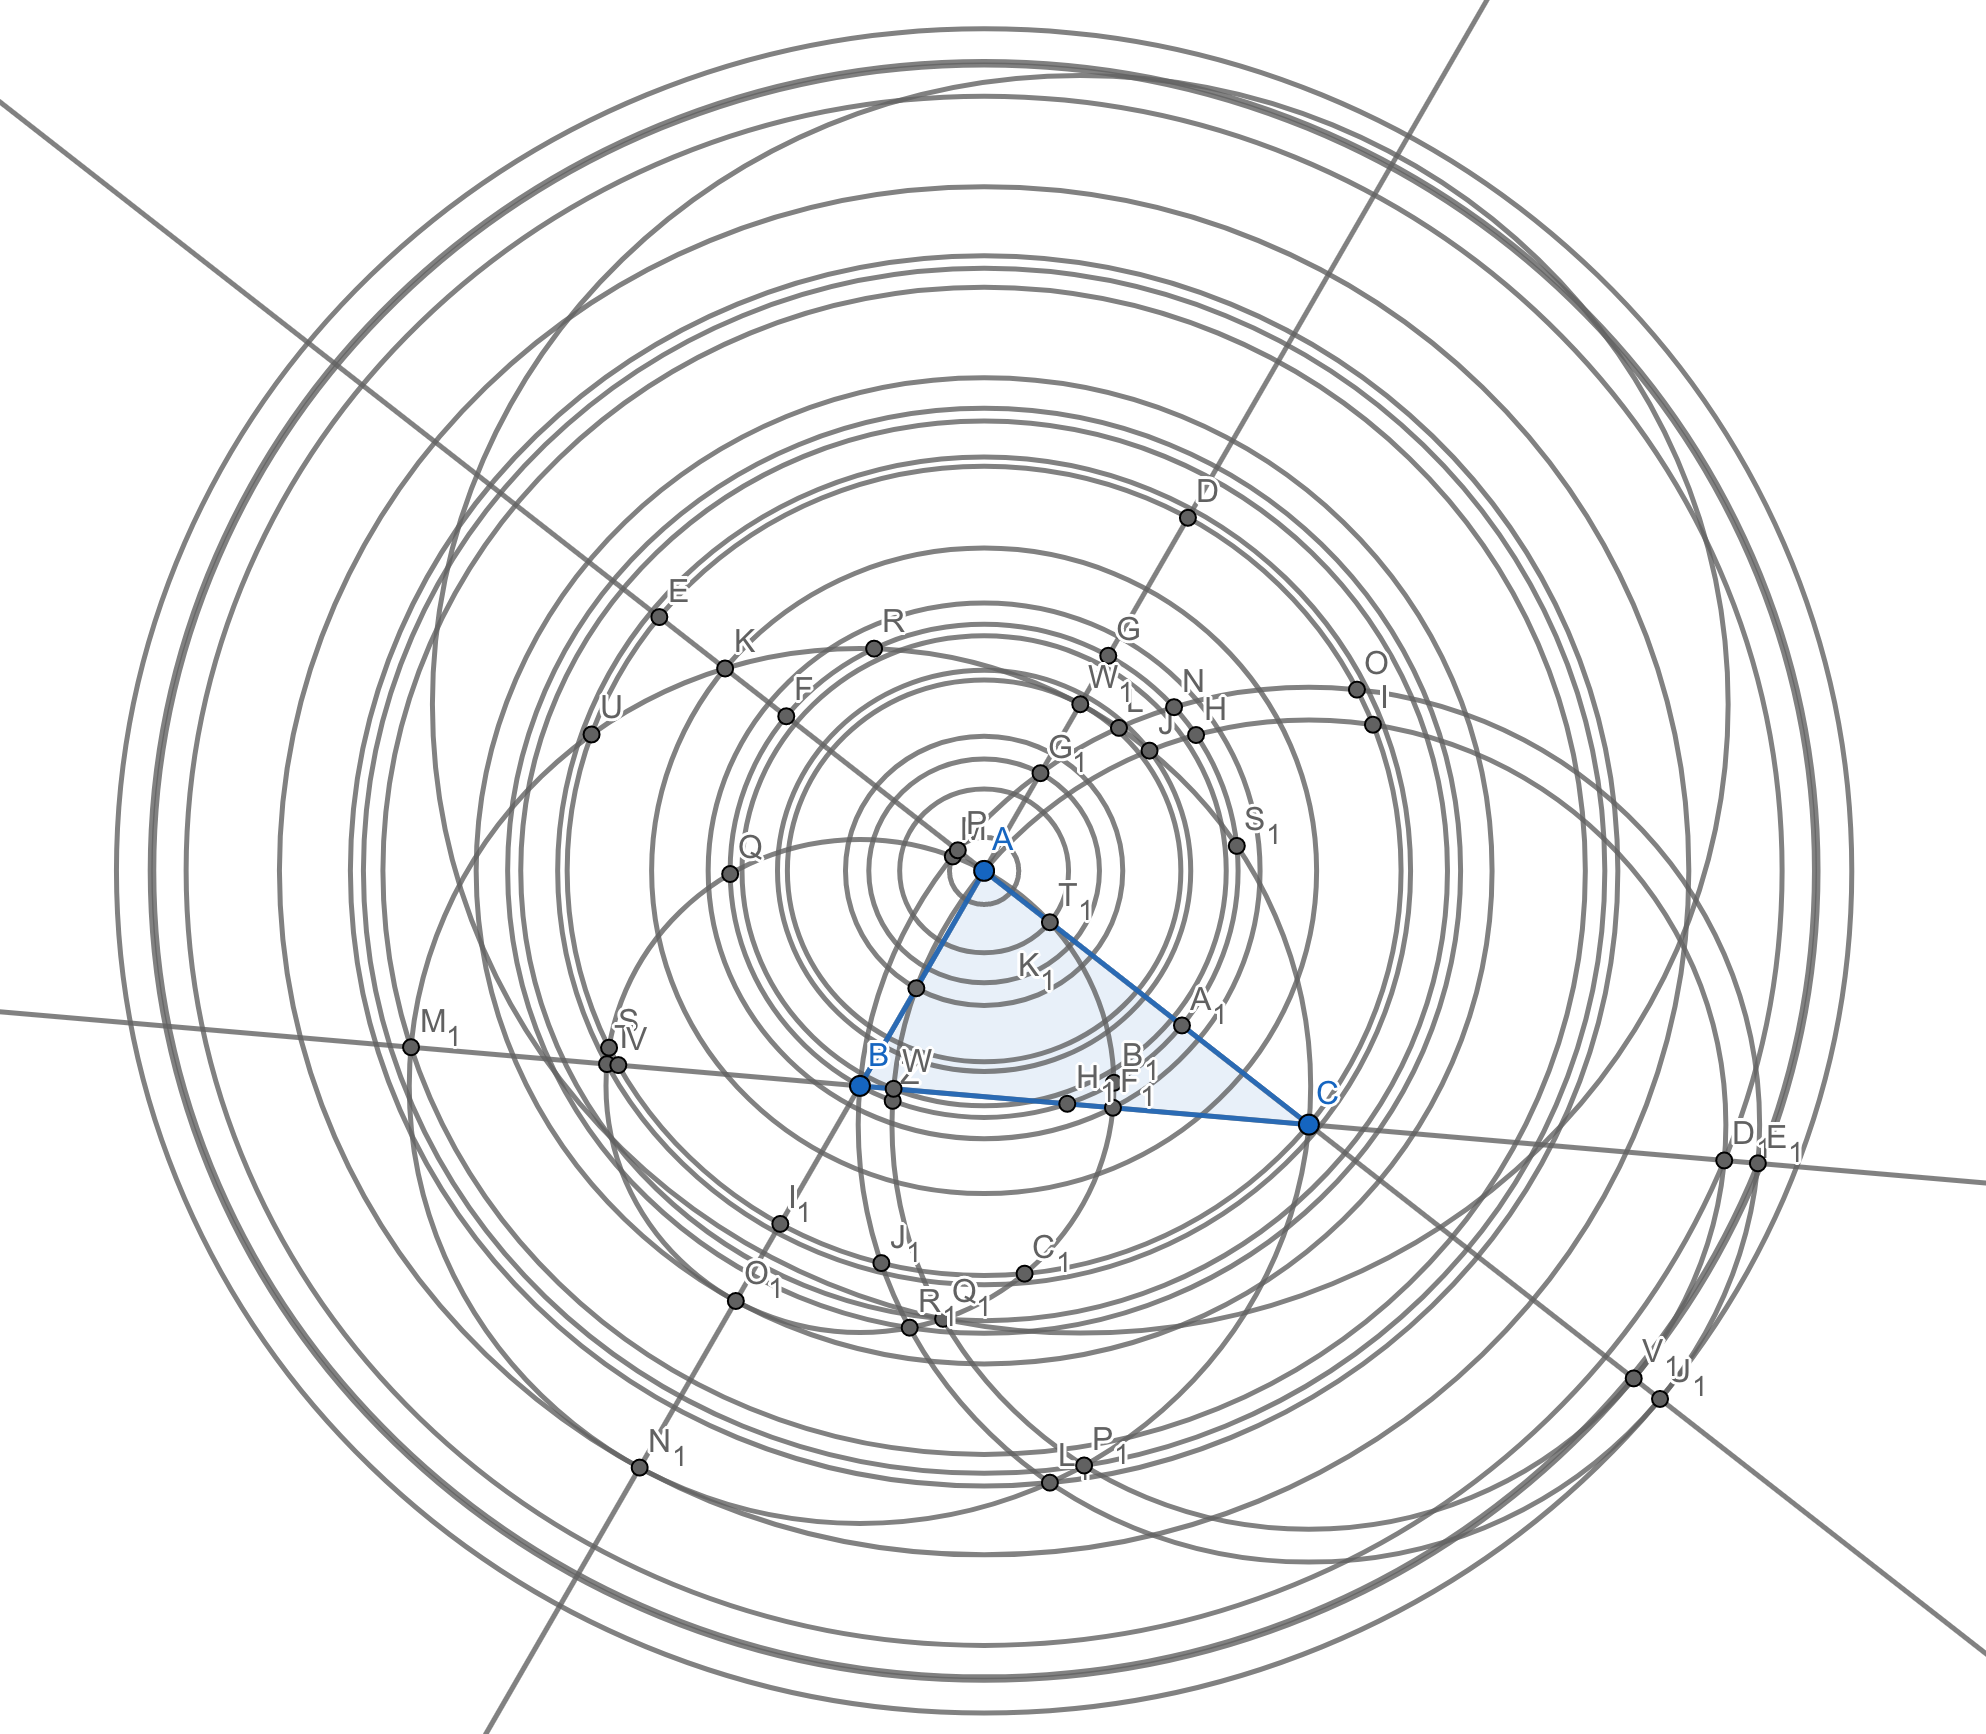
You can see the triangle and the 40-some labeled intersection points from the first round are still there. Realize I’ve drawn only about \(\frac{1}{47}\) of the circles I would eventually have to draw, and that I’ve ignored literally thousands of lines. So I imagine you’ll agree that we should be using a computer here, or some other non-manual algorithmic substrate.
And then I want to find all the intersections of all of those new lines and circles, plus the old ones.
And then I want to combine the new intersection points of those figures with the set of points we’ve already collected….
And then repeat.
There are limits
This process of points-to-figures-to-points probably wants a name, but I haven’t picked one yet. The points themselves are a subset of the constructible points. After a few rounds of this rapidly-expanding process, you’ll have a lot of points to keep track of, but of course no matter how large that gets it’ll still be a finite subset of an infinite set.
Let’s talk about the set of points that accumulate by this process. Not about how many it will contain—we’ve already established it’ll be a lot, and quickly—but rather where they are.
As you can tell from the bigger circles I’ve drawn in the last diagram above, the points seem to be moving outwards from the initial triangular “seed”. If I define the “origin” \(O\) of the process as the centroid of the initial points, how are points distributed radially from that point, over time?
After a few steps of iteration, we’ll end up with a truly huge collection of points. What will the radial density from the origin \(O\) be, in the limit?
Notice that in the first step of the process (at least with three points) none of the intersection points found fall strictly inside the triangle. In later stages, it certainly seems as though some will. Over time, would you expect more intersection points to fall on or in the convex hull of the starting points, or outside it?
I didn’t mention it before, but I noticed that even in my quick hand-made diagram, I was already drawing circles around point \(A\) that intersected more than one existing point. I am suspicious that a lot of the circles and lines I’d end up drawing in later stages were already present in the accumulating set. How quickly does that happen? Would you say there’s a point when a “significant” proportion of the new figures are already present?
One of the pleasant aspects of GeoGebra for this kind of sketch is the ability to drag points around in a diagram after drawing it, while preserving the geometric relations. In trying to draw that last diagram (with just the circles around \(A\)), I happened to stretch things into this configuration:
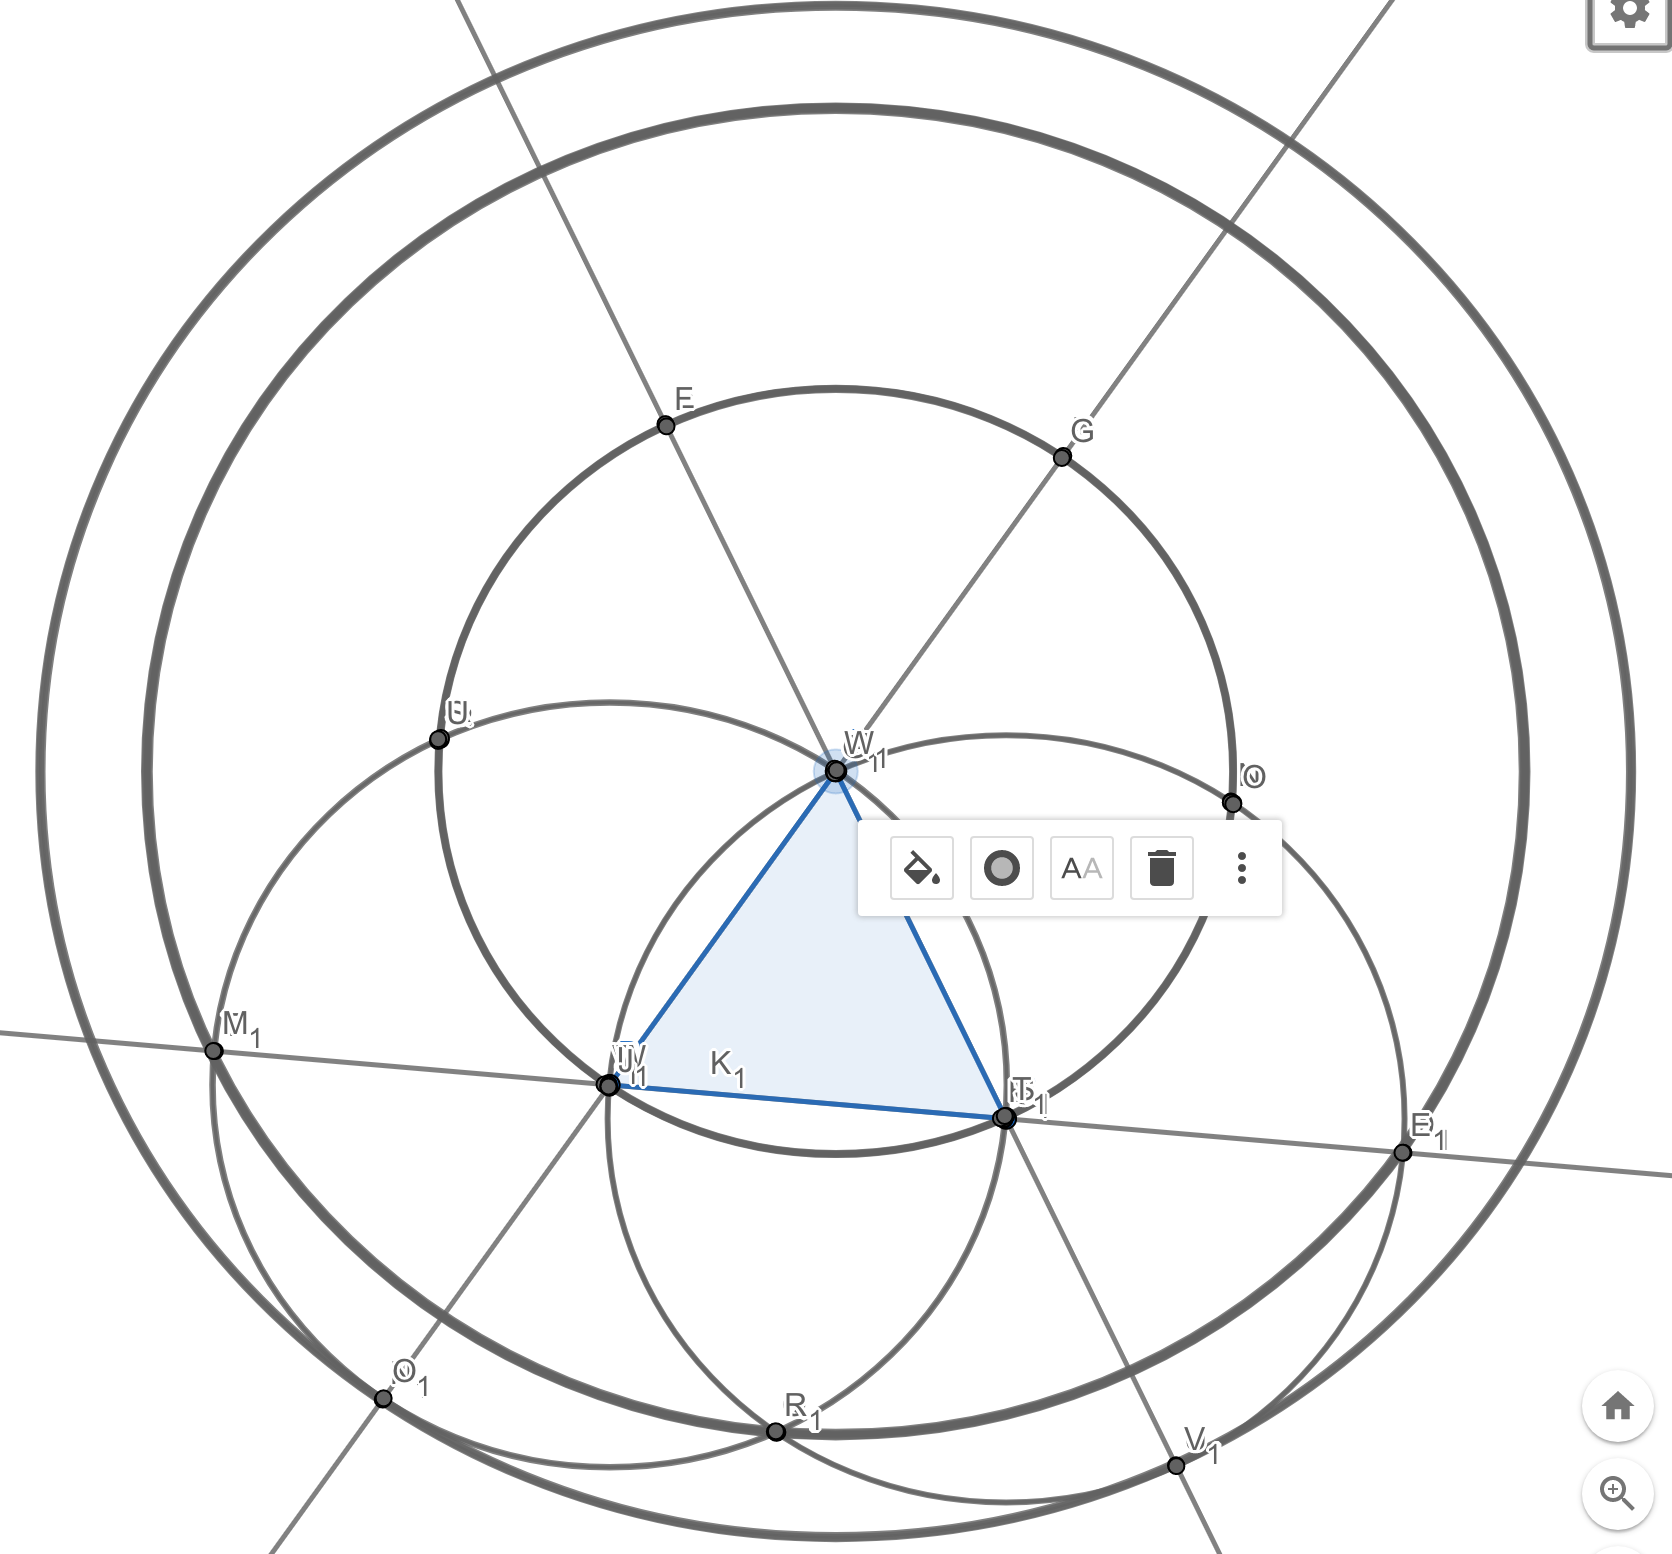
Isn’t that interesting? A lot of the circles seem to be collapsing down into coincident ones, don’t they? And as a result, a lot of the intersection points aren’t visible either. Obviously it’s something about the equilateral triangle I’m getting close to. But there’s such a huge variation in the number of intersections (and visible circles) between the “general position” I started in and the equilateral shape here, that I also want to ask a subtler question about some other “special” configurations of the starting points.
For instance: Imagine there’s a “most general” position of the initial points, which I will define as one that maximizes the number of points found after \(k\) iterations of the points-to-figures-to-points cycle. Maybe the “most general” is one where the distances and angles between the initial points are all different, though I’m not at all sure about that. And imagine there’s a “least general” position as well, which minimizes the number of unique points and figures in those sets. Maybe the “least general” will be something like an equilateral triangle (for three points), but I’m not sure here either.
What qualitative difference is there between a “most general” starting position, and a “next most general” one? That is, what specific “move” does one have to make to the initial set of points to reduce the number of points and figures just a little tiny bit? And how much is that “little tiny bit” by which it’s reduced? If there are millions or billions of lines and circles and intersection points after a few iterations, what’s the fewest number of those that can disappear?
Similarly, if we start at a “least general” position (whatever that is, as long as none of the starting points are in the same position), what “moves” can we make to increase the size of the point and figure sets after \(k\) steps?
There are also questions we could ask about the figures, as opposed to the points. Do the (unique) lines tend to have uniformly-distributed directions, or is there some kind of bias? Or consider the collection of circles as a kind of Venn diagram, and tell me what fraction of them are entirely contained inside others. Is the observed distribution of their radii “bumpy” or “smooth”? That is, are there eventually circles of all sizes, or are there certain radii that tend to be more common than others?1
And finally, something about “shape”: I have no idea, yet, about how symmetric the set of points will end up being, in the plane. I mean sure, it “feels” like it might be a process that’s not especially biased in terms of directions, but is it the case that the density of points along every radius out from the initial centroid \(O\) is the same? Are there certain angles that will be “empty”? When I say it that way, it makes me think of the density of points along an irrational sloping line on an integer lattice. But this isn’t the same kind of thing… I guess?
I suppose more generally I’m wondering about how “patchy” the set of points can be made. In the “most general” situation, is the density of points “more even”—radially, or maybe in some other way I can’t quite visualize—than it is in a “less general” one, where the number of unique points is smaller?
What to do
I imagine what I’ll do is something where I try to make accurate functions for finding the intersections of circles and lines. Then I’ll start recursing and looking at manageable systems of a few initial points and a few steps into the growing cloud of points and figures. And then I’ll probably get scared, or my laptop will burn my legs, and I’ll consider random sampling of some sort.
And I’ll probably draw some pictures.
Maybe you’d rather use mathematics. There’s algebraic geometry in here, and other useful representation schemes I’m sure.
In any case, I’m curious to hear what happens.
-
I think if I look at that figure above where I got close to an equilateral triangle, I would lean towards there being “biases” in the radii. But I confess that I don’t know anything at all about the “most general” case. ↩