On having two goals
Draft of 2017.01.01
May include: games ↘ planning ↗ &c.
When I give introductory classes or workshops on evolutionary computing and more general machine learning topics—and also my workshops on project management—I often find myself having to introduce the participants to the huge but little-taught discipline of multiobjective optimization. I don’t know why, but this always catches me by surprise, so I usually trot out the old “picking a car” analogy: “Suppose there are several models of car, and some are safe and some are cheap and some are fast and elegant. You want to pick the safest, fastest, cheapest one of course. Here are some numbers, which car(s) do you pick?”
This is the table of made-up car numbers I often use. It’s the same one I used here a few weeks ago, talking about evaluating Push programs:
 cost       accidents       GP10k
20000         190            200
30000         290            800
60000         160            500
30000         100            300
In most cases, saying “I want ‘the car’ with the lowest cost, the lowest number of accidents, and the lowest GP10k value” usually suffices to get us past the unfamiliarity of the whole thing. But these are workshops and online discussions with students and professional engineers and smart faculty, and this weird unfamiliarity with a crucial basic concept in mathematical modeling worries the crap out of me.
A car cartoon made of a few dozen static numbers doesn’t do the trick. If there’s a complex but easy-to-describe practice that people find counterintuitive, then dammit there should be a puzzle for them to think with. Not just a didactic bullshit homework problem like the “fast unsafe cars” one.
So today I want to try to present such a puzzle. As always, it’s a recreation not a homework problem. There is no right answer. There is no particular thing for you to do, and as long as I write it well enough, it should be fine (though insufficient in the long run) for you to just read and nod along. But while I will show you how I think about it and explore it, you’re encouraged to take the specification I lay out and implement it for yourself, in code or in a spreadsheet or even with pencil and paper.
Because this sort of thing actually affects our lives.
Starting With a Bang
For several years I’ve been selling off our personal belongings, including those of our parents (all dead, to clarify) on eBay. As you might imagine, three households—and more, because they all had items from old friends in their homes—ends up including a lot of small but valuable-enough-to-worry-about items. For the sake of this problem, let’s assume that the number of valuable-enough-to-worry-about items I want to sell is very large, and in fact practically infinite.
eBay isn’t just for “auctions”. I prefer to sell items using what eBay calls “fixed price listings”. These are just like simple “for sale” classified advertisements used to be: “1940s Rörstrand vase, $50”—plus of course the photos and description and a huge amount of other metadata that eBay displays. These are relatively inexpensive to launch, and low-maintenance from my standpoint: once I’ve constructed the listing, I can re-list it again easily (though at a cost) if the item it describes hasn’t been sold.
The important thing for us here is the fact that fixed price listings can be set up to last for exactly 3, 5, 7, 10 or 30 days. Because I’ve noticed that people tend to buy things only when they start or end, I don’t usually use the 30-day version. So today we will be limiting ourselves to fixed price listings with durations in the set {3, 5, 7, 10} days. No other durations are possible.
At the end of every fixed price listing, if it hasn’t sold, I will usually re-list it again. Because I don’t really know the most likely day when people might stumble across it, I will often change the duration of the re-listed item. If the first time I listed an item the duration was 3 days, then it may be 3 days again or 7 days this next time. To be honest, because it’s an infinite number of valuable-enough-to-worry-about items I deal with, I usually just randomly assign a duration to every item, every time I list it on eBay.
The duration of a listing is an independent and identically-distributed random variable, in other words.
The simulation
Suppose first that I’m starting from a clean slate.
On the first day of 2017 (which happens to be the day I’m writing this sentence), imagine that I have no eBay listings running. And that I have an effectively infinite number of listings to launch.
As I just said, every listing will be randomly assigned a duration of {3, 5, 7, 10} days. And whenever a listing ends unsold, I will re-list it the same day, possibly with a new duration.
Let’s define the simplest possible plan for launching listings as a single, fixed probability distribution over the durations {3, 5, 7, 10}. To simplify further, I will use fixed non-negative integer weights for each of those durations.
For instance, if I want to pick the four possible durations uniformly (with equal probability), then I might represent my plan as {3:1, 5:1, 7:1, 10:1}, meaning “\(\frac{1}{4}\) of the time, pick 3” and so on.
If I want to have no seven-day listings at all (ever), then I would represent my plan as {3:1, 5:1, 7:0, 10:1}, and now I could read this as “\(\frac{1}{3}\) of the time pick 3, \(\frac{1}{3}\) of the time pick 5, and \(\frac{1}{3}\) of the time pick 10”.
Every possible plan is essentially four non-negative integers, representing the relative frequency with which I pick each of the four possible durations every time I start any listing. If all of the four numbers are are 0, that implies that I will never list anything at all, and that’s boring, so let’s skip that one. So one number must be strictly positive, too.
On the first day (call it “Day 0”, because I’ve been working in programming languages that work that way), I divide up all my items according to this plan and launch them. On “Day 3, the specified fraction of the items I started on Day 0 will end, and I will immediately re-list those items again, dividing them into three, five, seven and ten-day listings according to the same plan I started with. And on Day 5, some (possibly different) fraction of the listings from Day 0 will end, and again I will re-list those according to the plan.
Then on Day 6, the fraction of listings that I started for three days on Day 0 and which also ran for three days starting from Day 3 will be ending. On Day 8, I will be re-launching items that have run through two cycles: three and then five says, and also five and then three days. And so on.
Because I have an infinite number of items, and because these are what we might call illiquid, let’s assume that I sell an essentially infinitesimal fraction of the things listed. Which is to say: let’s ignore “sales” for the sake of simplicity.1
As a result, we can treat the number of items ending and being re-listed on any given day as a strict proportion of all the items in the whole inventory. So I will refer to the number of things ending or being re-listed as a proportion. On Day 0, everything in my entire inventory is listed, with durations determined by my fixed plan. On Day 3, the proportion of everything that was listed on Day 0 for three days ends, and that is in turn subdivided again according to the plan and re-listed. And so on.
An example would be good about now
A simple plan might seem like a good place to start. Knowing nothing at all about how this works, how about “equal proportions for all durations”?
In the language-agnostic key-value pair notation I’ve been using so far, this might be something like {3:1, 5:1, 7:1, 10:1}. That is, one in four total goes to each duration.
         (re)starting    notes
day 0        1.0         all of them!
day 1        0.0         nothing ending today
day 2        0.0         still quiet
day 3        0.25        the 3-day listings get re-listed
day 4        0.0         nope
day 5        0.25        the 5-day listings get re-listed
day 6        0.0625      the 3-day listings from day 3
day 7        0.25        the 7-day listings get re-listed
day 8        0.125       3-day from day 5 + 5-day from day 3
day 9        0.015625    3-day from day 6
day 10       0.4375      getting complicated!
day 11       0.046875    definitely complicated from here on...
day 12       0.12890625
day 13       0.21875
day 14       0.078125
...
Here’s what the obvious “uniform plan” looks like, plotting the proportion re-listed every day for many more days:
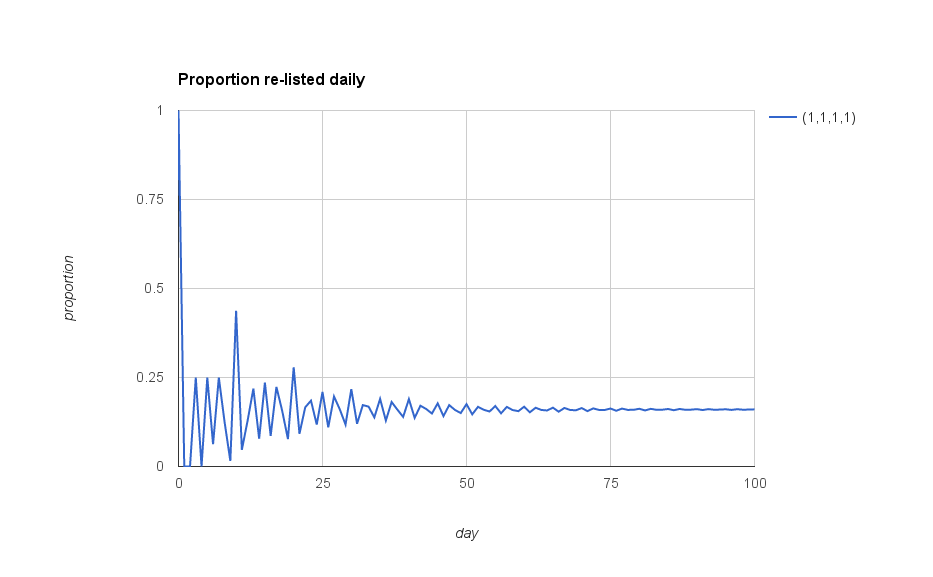
Hey, that’s pretty wiggly, isn’t it? I’m not sure I like calling it “uniform”, even. It eventually settles down so that I’m re-listing about the same proportion of all my items every day, and it looks like the eventual steady number is what I would expect: \(\frac{4}{25}\) or 0.16.
Wait—how can I know what to expect?
Here’s my intuitive reasoning to help explain why I expect that value: The average duration of any given listing will be \((3+5+7+10)/4 = 6.25\) days, right? So eventually, after everything has settled down from this wiggling, every day I will be re-listing an equal fraction of the items, and that would be the reciprocal, or \(\frac{1}{6.25}=0.16\) proportion of all my items.
I wonder what other plans might look like. Here’s a plan in which I changed the weights to be {3:4,5:3,7:2,10:1}; in other words, 40% of the time the duration is three days, 30% of the time it’s five days, 20% of the time it’s seven days, and 10% of the time it’s ten days. I didn’t pick these numbers for any particular reason, I just was curious to see what would happen to the wiggling line over time.
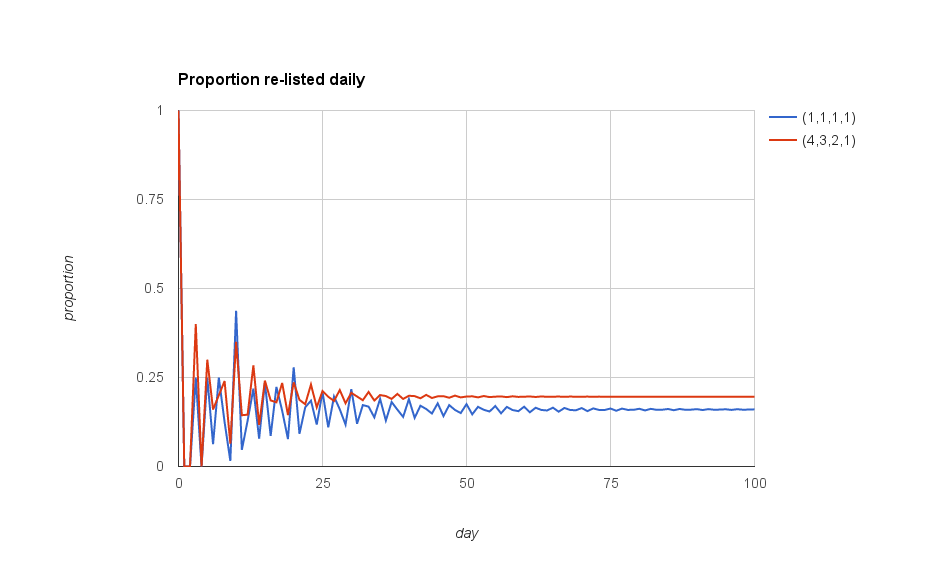
Looks as though the (4,3,2,1) plan is different in a couple of ways: It seems to spend less time than the “uniform” plan wiggling around before it settles down, and it also settles down to a higher proportion of items being re-listed every day.
For any given plan, I’d expect the average duration of any particular auction to be the weighted average of the lengths according to this plan, so in this case I expect the duration to be \((4 \cdot 3 + 3 \cdot 5 + 2 \cdot 7 + 1 \cdot 10) \div (4+3+2+1)\), or 5.1 days. Once it settles down, then I suppose I would be re-listing a fraction \(\frac{1}{5.1}\) every day, or about 0.19608. And indeed, that’s the number I’m seeing in the spreadsheet I’m using to simulate this.
As before, I don’t think I like the wiggling. I understand that, starting with everything the first day and having to wait three days, I’ll inevitably have to list everything the first day and wait for the three-day listings to end before I can start re-listing. But on the other hand as I get older I find that I like my days to be consistent, one to the next.
It’s encouraging that the wiggling is dying off faster than it was in the previous plan. I wonder what happens with other plans of this same sort? Here’s another one added: {3:7,5:2,7:3:10:0} (which I’ve picked out of thin air, I promise).
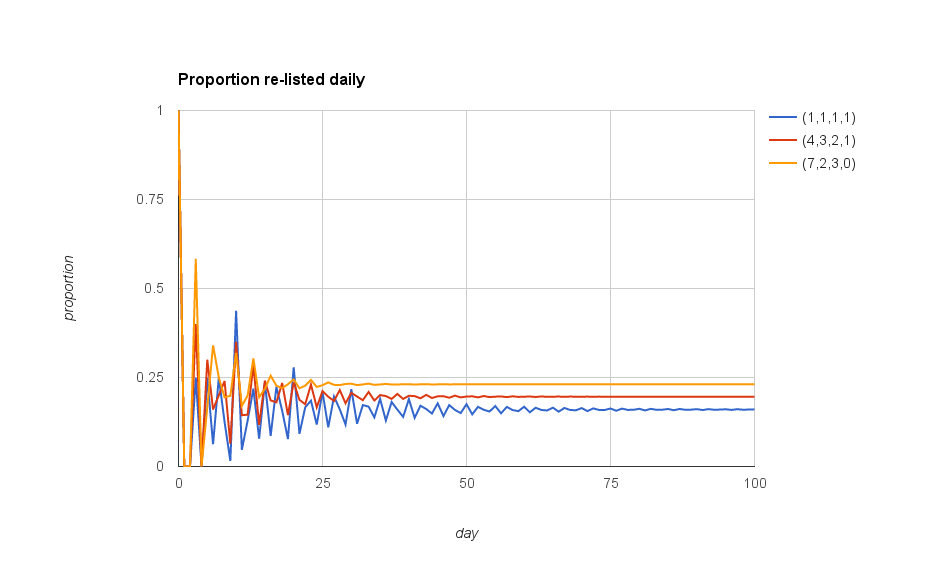
Oh, interesting. Again, it seems to be less wiggly—that is, the transient before we reach the stable average re-listing every day seems to be shorter than in the other cases. And also again, the average number re-listed seems to be higher. That latter makes sense, because this plan has no ten-day listings, and far more three-day listings (proportionately) compared to the other two plans.
One more, also randomly designed. This one is the plan {3:0,5:1,7:0,10:2}.
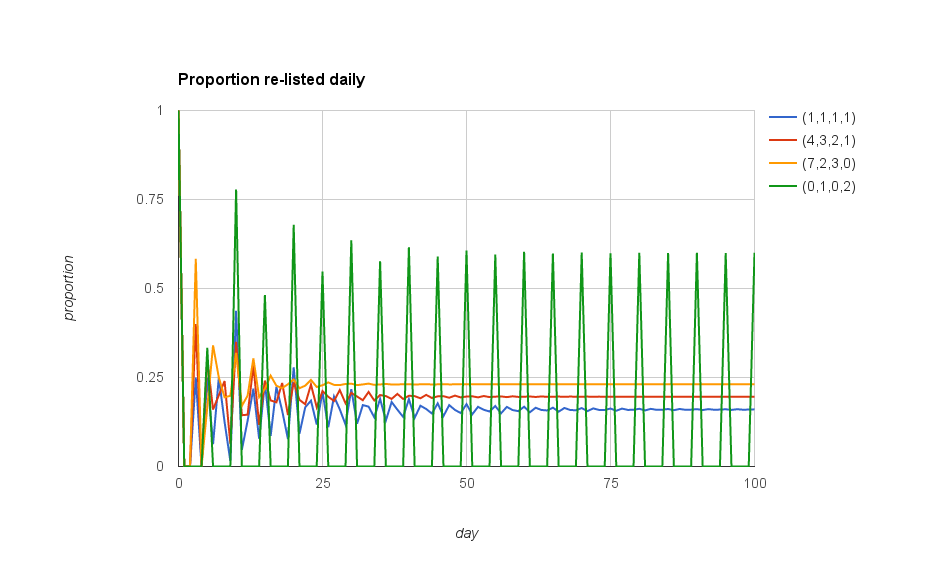
Wow. OK, I am totally definitely not liking that one as a plan for my eBay re-listing schedule. While the average duration of items will be \((5 \cdot 1 + 2 \cdot 10) \div 3 = 8 \frac{1}{3}\) days, and thus the average proportion listed every day is 0.12… there’s the problem that I’ve only permitted five and ten-day listings. As a result, everything quickly becomes synchronized, and the “transient” wiggling is in this case permanent oscillation. Instead of 0.12 being re-listed every day, what we get under this plan is a proportion 0.6 of all the listings being re-listed every five days, and four out of five days when nothing happens at all.
Nope. I don’t like that at all. Let’s not do that.
Just what is it that I want?
So far I’ve been exploring some of the possibilities of different “plans”. Just glancing at the plots I’ve made of the proportions changing over time, I can start to pick out a few things I like, and a few other things that I don’t like as much. Here are my criteria, at least so far:
- I want to pick a particular plan and stick with it. That is, on every day when there are any listings to create, I will always use the same proportion of three, five, seven and ten day durations. And because I like round numbers so much, I’ll only ever look at plans with integer-valued weights, and of course at least one of the numbers needs to be non-zero if I’m going to sell anything at all.
- I’ll start all the listings on the first day—bang!—and then on any day when any of those end, I will start them again, breaking them up according to the plan’s weights.
-
After looking at the plots of several plans, I realize that just because of the aesthetics I want to minimize the duration of the “wiggling” it does. I want it to settle down to a single value as soon as possible. And of course after looking at that last one
{3:0, 5:1, 7:0, 10:2}, I obviously want the “wiggling” not to be permanent.In other words, I want duration of the transient before a given plan stabilizes to a single value to be as small as possible. That should handle the “infinite oscillations” case.
- Because eBay charges me for each listing and re-listing, I want the expected number of items re-listed each day to be as low as possible.2
Does that seem straightforward? If I was going to be a bit more precise about it, I might say something like, “I want to find the plan that minimizes the expected proportion each day, and also minimizes the duration of the transient delay before that expected proportion is realized.”
And how do I get that?
In case you haven’t recognized the fonts and colors on the charts, I should tell you that so far I’ve been using a simple Google spreadsheet to simulate this all. I’ve always thought that spreadsheets are an excellent and useful approach for simple simulations like these: they provide a simple built-in way to visualize data as you explore, and a whole pile of interesting functions.
That said, already with four different “plans” I’m starting to feel a little crowded, both in the spreadsheet itself and the plots I’ve been showing. Assuming I’m “right” with my value judgments above, and I do in fact want to minimize the two specified numerical properties of these plans’ behavior, maybe it would be easier to work in a more easily wrangled programming language and a slightly different visualization scheme.
My second criterion seems easier to think about: I want to minimize the expected proportion re-listed every day. I can calculate that expected proportion by taking the reciprocal of the average duration of listings for any given plan, weighted by the plan’s parameters. So for example
{3:1, 5:1, 7:1, 10:1}gives an expected duration of \((3 \cdot 1 + 5 \cdot 1 + 7 \cdot 1 + 10 \cdot 1)/(1+1+1+1) = 6.25\) days, so the proportion is \(1\div6.25 = 0.16\) per day{3:4, 5:3, 7:2, 10:1}gives an expected duration of \((3 \cdot 4 + 5 \cdot 3 + 7 \cdot 2 + 10 \cdot 1)/(4+3+2+1) = 5.1\) days, which gives a proportion of \(\approx 0.96078\) per day{3:1, 5:2, 7:3, 10:4}gives an expected duration of \((3 \cdot 1 + 5 \cdot 2 + 7 \cdot 3 + 10 \cdot 4)/(1+2+3+4) = 7.4\) days, or \(0.\overline{135}\) per day{3:0, 5:1, 7:0, 10:2}gives an expected duration of \((3 \cdot 0 + 5 \cdot 1 + 7 \cdot 0 + 10 \cdot 2)/(0+1+0+2) = 8 \frac{1}{3}\) days, or \(0.12\) per day
I’ll want a plan that minimizes that proportion. I’m seeing a lot of variation here, though, and there are a lot of different plans possible. As you might suspect, this seems simple only because I’m not done yet.
Because of course I also want to minimize the “duration of the transient” before that proportion is realized. Even for one of the four trivial plans I’ve pulled out of thin air, it looks as though the little wiggles of the “transient” will be oscillating forever. And there’s a lot of variation among the other three; they settle down, but only over a period of months.
Measuring wiggles
Maybe what I really want to say—just so I can measure it—is that if there’s some day on which the “wiggling” becomes very small compared to the expected value, then I want that day to be as early as possible.
Looking at the plots I’ve shown above, and just thinking for a moment, it feels as if the longest possible “oscillation” is 10 days. If a plan’s proportion is going to wiggle at all, then surely it must do that wiggling within a given 10-day period, right?
I think so. Probably? I’m not here to do probability theory with you, so I’m going to guess.
Suppose therefore that I have to simulate a given plan’s behavior, in the same way I’ve been doing to make the plots I show you above. I collect a time-series of numbers for every day, starting at Day 0 and on into the simulated future, which indicate what proportion of listings are re-listed on that day.
Now, it strikes me that if I already have that time-series, then I can construct a second one that measures the degree of “wiggling” over time. I suppose that if you’ve take a Statistics course or are intrinsically prone to such notions, you might be thinking of measuring the variance or standard deviation of a number of days, or something. I think that would be a bit too complicated for my goals here, and besides I said I wanted to measure the wiggling, not the probability distribution over time.
To me, “wiggling” is about extremal variations. So I’m going to try looking at the absolute range of measurements over the preceding 10 days. For each day of simulated time under a particular re-listing plan, I’ll also calculate the highest and lowest values observed on that day and the preceding ten days. This derived time-series of “moving ranges” will help me measure the wiggling as it dies off.
At least… I think so?
I should check to see if this makes sense. While I still have it open, I’ll try it with my spreadsheet simulations. Now I have to say: my spreadsheet is ugly, in the sense that I haven’t been tidy putting it together, and I’ve been overwriting it to make these plots and run these little simulations. So I won’t share that with you. But then again, it’s also not that complicated, and building your own spreadsheet may well help you write code in some other programming language later on. Though to be frank if you’re working in a “real” spreadsheet (like Microsoft Excel or Apache OpenOffice) you actually can write scripts within the spreadsheet to help you out.
Anyway, this is what I see when I calculate the 11-day “moving range” for the four plans I’ve already mentioned. This is a plot of the difference between the highest-valued proportion and the lowest-valued proportion on each day, and also on any of the ten preceding days:
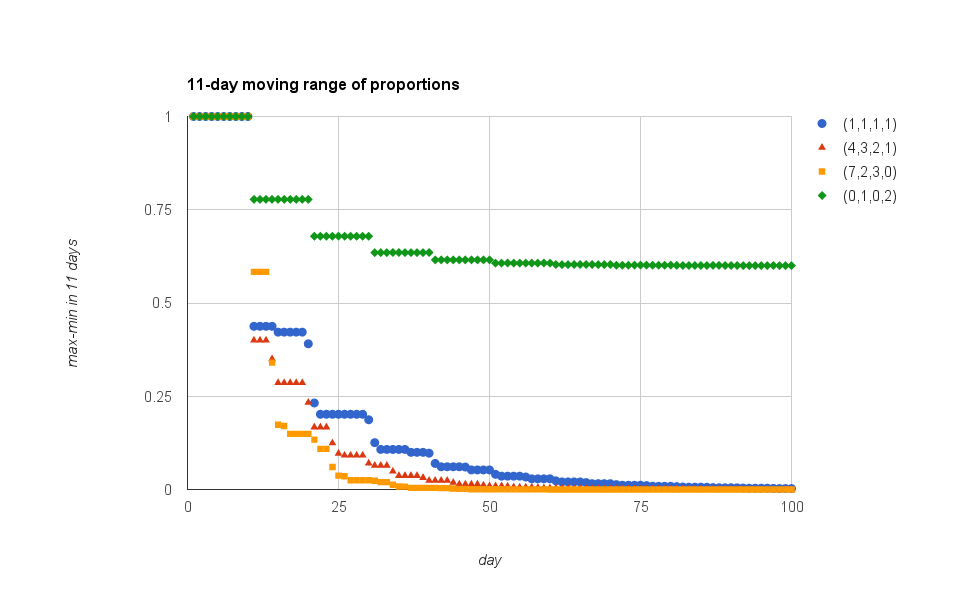
Well one thing is nice about this: at least for these four plans, this number is monotonically decreasing. And I can totally see the “bad” oscillating plan will never reach a value of zero.
In fact, there’s something else I see here, which tickles a memory from my days as a biochemist. Let’s look at what happens when I plot this on a semi-log plot, with the y axis logarithmically transformed:
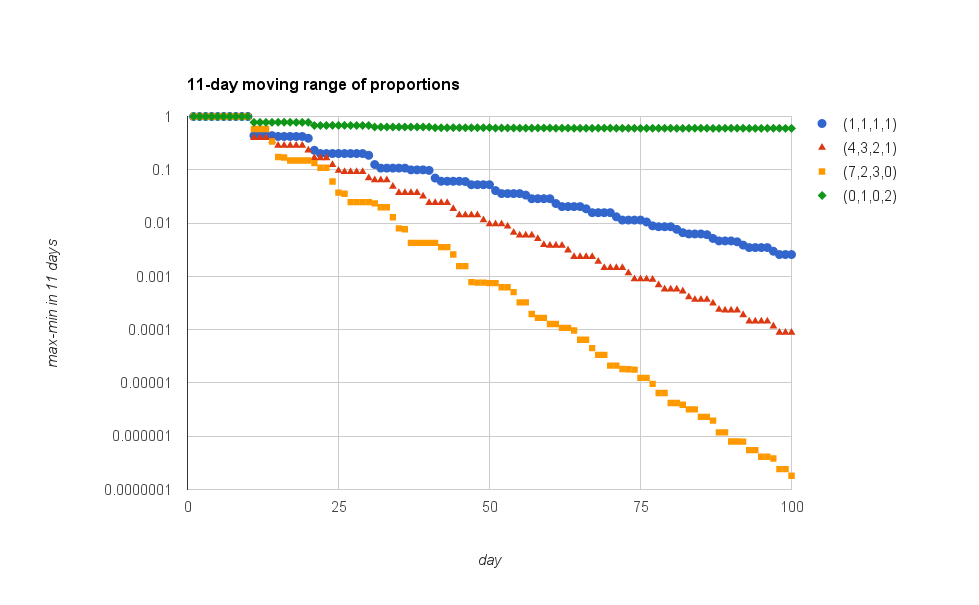
Aha. Interesting, isn’t it? To be honest, I didn’t expect that to happen—though I’m sure my Statistician friends will probably point out how obvious this sort of thing would be, and blah blah asymptotes and so forth. They do that a lot; I am forced to nod and smile and act appreciative most of the time.
In this case, this log-linear looking “behavior” could be very useful. Well, technically it’s clear that there is still something “oscillatory” going on, and that as a result the behavior isn’t “log-linear”… and then there’s that interesting joggle at the beginning of each time-series, before things start to repeat and recurse. But they seem kinda straight. Ish.
Just to see if this bears out for more plans, I’ve typed in some more arbitrary ones, just to see what happens in their 11-day moving-range plots:
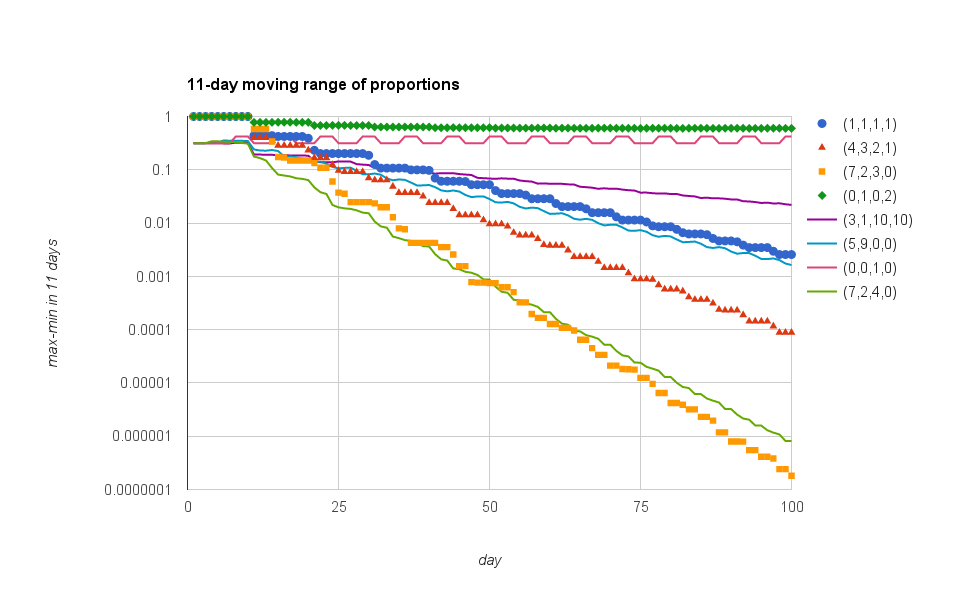
The interesting ones, to me, are {3:0, 5:0, 7:1, 10:0} (which is the magenta wobbling line up near the top of the chart), and {3:7, 5:2, 7:4, 10:0}, which sort of overlaps the {3:7, 5:2, 7:3, 10:0} line I’d earlier explored.
I think what I might be willing (and able) to do is something like this for my second goal: Minimize the day on which the 11-day moving range first falls below a threshold of 0.0001.
Of course that’s arbitrary, and I could as easily say 0.001 or 0.00001, but here’s the kicker: notice that these are all, with some periodic fluctuations, monotonically decreasing. The only one that seems to be non-monotonic, {3:0, 5:0, 7:1, 10:0}, is wobbling up a little bit because some days an eleven-day window includes two “re-listing spikes”, and some days the window only overlaps a single spike. In other words, the period of that wobble is an artifact of the moving range size, not the inherent process.
But “the first day on which the 11-day moving range falls below 0.0001” is a thing I can observe.
Knowing too much for your own good
I expect you’re a very patient nerd, since you’ve read this far. That implies that to some extent you might already “know” how this turns out. Maybe you’ve done some integer programming in school, or you’re starting to think of things like Markov chains and transient variation and asymptotic approach velocities and stuff.
Stop it.
This is, above all, intended as an exercise in seeing the details of a particular special case. For some fraction of you, who have done some linear algebra or maybe linear programming, I’m about to tell you to do something so totally stupid (within the framework of your experience) that I suspect most of you have never even considered it.
Which is the point. Hold your horses and try to play along. You might learn something surprising.
What are the chances?
Given this exploration, I’m comfortable rewriting the list of things I said I wanted more simply:
- I want to explore the set of all possible plans with integer coefficients
- I want a plan where the proportion re-listed each day is lowest
- I want a plan where the 11-day moving range drops below
0.0001first
There are two derived measurements to be made here for any given plan: the expected proportion re-listed each day, and the day on which the 11-day moving range drops below threshold. Each plan has an associated vector of two values, in other words.
Looking to see
As I said above, I’m kinda tired of spreadsheets—though I might use them to draw charts, still. I think it’s probably time to re-write my terrible kludgey spreadsheet into a little program. Now I’ve been working in Clojure for a long time, but I have found recently that a lot of people don’t really like to read Clojure code.
How about Ruby?
Next time I’ll walk you through the little program I wrote, so you can write your own version (in whatever language you prefer) that simulates this re-listing process and lets you evaluate various plans in terms of their expected proportions and transient duration.
Then we’ll get to the real meat of the problem: What do you do to find the “best” one(s)?
What’s that you ask? Why did I leave that “one(s)” ambiguous? Do I expect there to be ties or something?
As it happens, I’ve already gone ahead a bit and scouted out what happens when we plot a bunch of different plans, with their transient duration vs. their expected proportion per day. Here’s what I see, when I look at every possible plan that has numerical weights chosen from the set {0,1,2,3,5,8}:
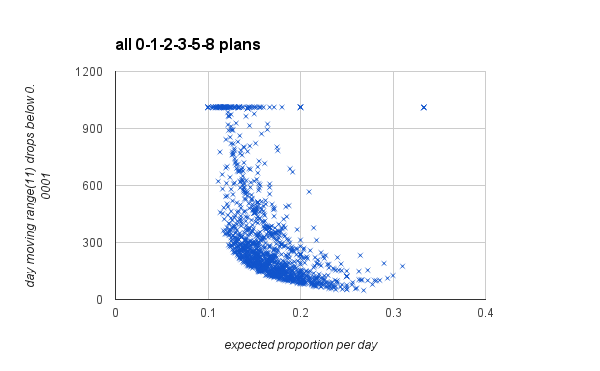
Each x represents the measurements I’ve made for a particular plan. I calculated the expected proportion re-listed each day, and simulated the plan and measured the day on which the 11-day moving range fell below a threshold of 0.0001.
As I’ve said all along, I want “the plan” that minimizes both those values.
Which one do I want, then? The ones in the bottom of the plot have very brief transients… but relatively high proportions re-listed every day. And the ones in the farthest left of the plot have very low proportions re-listed, but apparently those are the plans that oscillate forever. (I got bored, so I only simulated 1000 days, so that horizontal line of plans up at the top represents those plans where the moving range never dropped below threshold in 1000 simulated days).
And that, my friends, is the point. We’ll come back to this question next time, but the point is that every interesting engineering or design problem should look more like this.
You may think you want a single “best” plan that does well at everything, but the world rarely (never, I would say) cooperates and gives you that option.
-
Historically this has been shown to be a valid assumption. Dammit. ↩
-
You’re a smart nerd, so you already noticed that any proportion of an infinite number of items is going to cost a lot of money, right? To be honest, this is an artificial criterion… but I’ve already burned the “aesthetic reasons” card. Go along with me, OK? And don’t tell the not-so-smart nerds who didn’t bother reading this. We’re just going to try to minimize the proportion I re-list every day. ↩