Against bad grading practices
Draft of 2005.02.09 ☛ 2016.07.17
May include: academia ↘ advice ↗ &c.
A discussion elsewhere has sparked a tangential thought on grading. Something that’s been bothering me for years. I think rather than pound my walking stick on the table here (as I am wont to do), or drift the thread in the wrong direction there, I’ll just propose it as a series of leading questions and biased examples.
Suppose you’re the instructor of a class of 100 undergraduate students. Your goal is to give them grades. That’s because the University demands a single grade in the end. And because it’s convenient for you to just write down one number and be done. And because that’s the way they’ve always done it, and what was good enough for you… OK, sorry, that’s the walking stick.
Suppose for the sake of my pretty pictures that you’ve given your students two big graded assignments: a 40-page research paper that they had four weeks to complete, which was graded on comprehensiveness, insight, and clarity [but given one grade—oops]; and a final exam which they took in a cold winter lecture hall in an unfamiliar part of campus, which focused for two harried hours on their mastery of domain knowledge. Of course these two [or four] tasks demand quite different skills, and occurred on different days, and under different stress levels and social conditions. But you’re a grader, see, and you make grades. It’s what you’re for. So here are their grades:
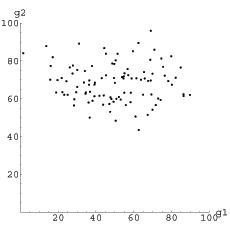
These are just random numbers I’ve picked independently from two normal distributions with different means and standard deviations, and truncated at 0 and 100. You can play with it later. I’ve had grade books that looked something like this, so I’ll presume this is a realistic enough model for our purposes. I’m also eliding the fact that these are samples; maybe I should have said that the first is the sum of 20 homework grades, and the second the sum of 10 oral presentations. That’s for another day….
December 22, and grades are due. And your grant proposal is overdue! Shit. Who gets an A, and who gets an F?
You know the answer, of course: You add the points up, and look at quantiles of some sort. Duh.
But hey, some instructors like to game this a bit. They sense that a point on the big paper is worth more than a point on the final, so they weight that project a bit more heavily. The resulting final score is, say \((2 g_1 + g_2)\). But wait! In the physiology and organic chemistry classes I suffered through as a wee child, the “words” part was entirely disregarded, and the point of the class was how much you recalled. I’d say that final grade was more like \((g_1 + 9 g_2)\).
Hmmm. Oh, man, you’re never gonna get that proposal done at this rate. So different students apply different levels of ability to the tasks, which are themselves noticeably different (look at the variance). And different instructors apply different affine combinations of these multiple grades to come up with a single score? And don’t forget that the University is averaging those scores, and handing out millions of dollars.
\((0.67 g_1 + 0.33 g_2)\) and \((0.01 g_1 + 0.99 g_2)\) give very different rank-orderings. Let’s look at how the students in our example class fare over the range of all possible such affine combinations. That is, from the touchy-feely instructor who gives them a grade based on 100% of the paper and 0% of the final, to the Memory Mistress who throws the wordy paper away and just keeps the facts, ma’am.
Here we go:
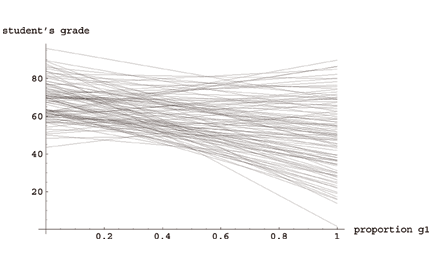
Put the grant application away and get your grade book out. Your simple choice of weights can make a huge difference in the resulting grade of the students. By selecting one of these many affine combinations—even the “add them together” one that is \((0.5,0.5)\)—you impose a whole slew of your assumptions on the ranks of the students. People who aced the exam can still come in at the middle of the range (or the bottom; witness the two extremal lines on the upper left and the lower right of the spaghetti plot, which are people on the extremes).
OK. Time for the walking-stick now. I’ll not brandish it (I’ll save that for the next time I’m forced to review your ridiculous manuscript, or sit in your audience at a conference), but just gently indicate where I’ve leaned it against the table, with a glance and a subtly raised eyebrow. This particular walking stick represents my defense against the mindless, habitual, prejudicial ignorance that drives people—engineers, scientists, instructors, bankers, and frankly anybody who uses numbers to make decisions—to just add shit together. Where “shit” is meant to imply apples and oranges, or risk and return, or cost and safety, or efficacy and toxicity… or writing ability and memorization skill.
That’s tacit prejudice. Not “expertise”, which is what a lot of righteous people claim when they are challenged—it would only be expertise if there wasn’t another way to do it. You think you know writing is 2/3 as important as the final? And you know the final demanded exactly four times as much domain knowledge as the quizzes? And you know that each student will need that exact, blessed ratio to be successful in life? Bullshit.
OK, I’m putting the stick down. Sorry.
Let’s review: You want to give the highest grade to the people who simultaneously did the best on a number of different measured scores. But there are some people who do well on one task, and poorly on others. As long as these tasks are not repeated samples of the same random variable, you can’t justify any particular affine combination of them without invoking your imaginary tacit knowledge of “how it should be”. The order of the students changes a lot in that spaghetti graph up there. How certain are you of your one choice along the x-axis?
We learn single-objective (scalar) optimization first, and rarely ever hear about multiobjective (vector) optimization. This is justified by saying that the intuition and tools developed for scalar optimization “just scale naturally” to vectors, but (a) that’s a lie, and (b) scalar optimization is thought to be “easier” and (c) it was invented first, so more people have heard about it. Prejudice, in other words. Scalar optimization is a special case of multi-objective, and a weird one at that.
Look at how stupid you have to sound to be able to communicate the simple idea of dominance: Examine a list of scalar (single-task) grades. The order is obvious, right? Best is highest, worst is lowest, and there are some rare ties. But the order can also be stated this way: “the best sample is the one such that the fewest number of other samples have larger values, and the worst is the sample such that the most other samples have higher values.”
Doesn’t that sound dumb? But that’s how we talk about dominance in multiple dimensions. The best sample is non-dominated, and the worst sample is dominated by the most others.
Just as in the scalar case, in multiobjective situations, we say that one sample strictly dominates another when it is simultaneously higher on the basis of all objectives. See how that maps to one task? But it also sounds like our grading issue, doesn’t it? “You want to give the highest grade to the people who simultaneously did the best on a number of different measured scores.”
Let’s revisit our students. The grade of A goes to the students whose scores are dominated by the fewest of their peers; these are the ones at the edges of the upper right of Figure 1 above. Notice that the student at the highest paper grade, and the one at the highest final exam grade will both get As under this system. Note also that this order does not depend on linear scale of the axes: you can multiply the scores by whatever (positive nonzero) numbers you want, and you’ll still end up with the same exact rank-ordering.
That sounds all weird. Sounds like the result will be people getting high grades who don’t deserve them, doesn’t it?
Deserve them on what basis? On your presumptuous affine combination basis, is what you mean. Go look at Figure 2 again, whenever you think your favorite affine combination is best, and just notice that all the choices people tend to use (towards the middle) are in the region where the strict order of students is changing most rapidly. A slight error or deviation to a choice made in that region can cause mayhem in the exact orders. How does that make you feel? More confident?
But here’s a lifeline: Let’s order the students according to the good old add-’em-up \((0.5,0.5)\) affine combination, and plot that score against a ranking based on the number of other students whose grades strictly dominate theirs. (what I’ve done is subtract the number of students that dominate from 100, so both ranges are 0–100, increasing). Here:
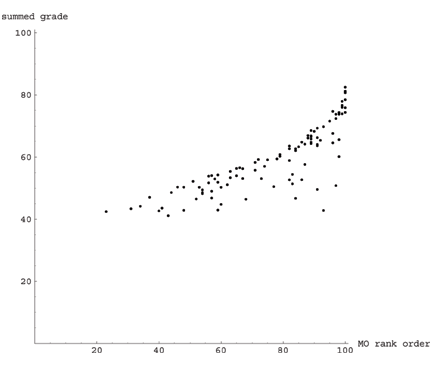
The horizontal axis is the multiobjective rank-order. The ones over towards the right are beaten on all tasks simultaneously by the fewest of their peers, and the ones over towards the left are the worst at everything simultaneously (again—this is 100% independent of the relative weights). And the vertical axis is the traditional 50/50 averaged score. People near the top of that range are the ones that scored the most points overall, and people on the bottom are the ones who scored the fewest overall.
Personally, I kindof like it. These two ranks are strongly correlated, which implies that this approach shouldn’t violate too many of your treasured assumptions. But it also manages to allow students to excel at their strengths, and forgives them for their weaknesses. The “troubling” part might be that the traditionally “worst” students tend to get the biggest boosts. There’s that one, down in the lower right, who would surely have failed the traditionally-graded class but who is in the upper ranges in the multiobjective ranks. Why is that?
It’s because I picked the data so the two tasks (paper and final) are uncorrelated with one another. What would happen if they were strongly correlated? Draw it and see; the more correlated the multiple grades, the closer the ranks will be to the traditional average. But what if they are more strongly anti-correlated? Here are the students’ grades for an oral presentation plotted against their paper grade (same ones as above):
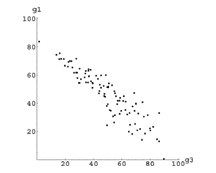
You still want to add these two scores up? Even though it’s clear that people who do well on one assignment tend to do worse on the other? Eyeballing it, it seems to me that the highest-scoring person on the presentation is going to get a below-median grade that way. You want that?
You’re confident that presentation skills are exactly equivalent to final exam skills? I see. So that’s why you always put writing your talk off to the last minute.
No, really, lets talk about correlation for a minute. Let’s suppose that the big components we’re talking about here are qualitatively different tasks: quizzes and homeworks and speaking and singing and doing proofs and writing programs and explaining things and doing library research and writing well and making precision parts, say. If you plot some pair of these, and there’s a huge correlation in the students’ actual scores, what does that mean? If they’re anti-correlated, what does that mean? About you, and about your students, and about your “testing instruments”? About differential ability on both sides of the line?
As a decent instructor, you will give multiple assignments to your students. Whether you acknowledge it or not, the grades on those assignments will not only be subject to variability, but the assignments themselves will be different. Some assignments will inevitably stress different skills. Your students have heterogeneous ability and aptitude levels at those multiple skills.
Which of their skills is better? How much? And who are you to choose?
That last is not a question to offend. That’s a question about the nature of decision-making.