You should be using ParetoGP for symbolic regression
Draft of 2016.09.01
Continues “Among the Big Scientists” and “One helpful way to think about GP”
Let me review what’s provoked this series of essays:
I find that most people come upon genetic programming in its simplest form, symbolic regression, and imagine that it’s something like the other Machine Learning tools they’ve used or read about. That is, they assume (or are told) that they can “use” symbolic regression as a sort of off-the-shelf approach for simultaneously discovering mathematical models of their data, and also optimizing and fitting those models. But it turns out the other Statistics and Machine Learning techniques—support vector machines, logistic regression, decision trees, naive Bayes classifiers, and so forth—are deeply different in both scope and behavior from GP.
This causes problems.
The discipline of Statistics, and Machine Learning in particular, offers a wide-ranging suite of powerful tools you can reliably apply to datasets in order to uncover patterns and insights. When a tool is “well-suited” to your data, you can expect the results will be informative, but not surprising. When a tool is not “well-suited” to your data, then you can expect the results to be disappointingly uninformative, but not bafflingly so. The history and philosophy of the way our tools rely on this particular relation between “researcher and data” are something I’ll write about on another day; suffice to say there’s a long and deep history in our scientific and engineering cultures of not wanting to be surprised.
When you do a linear regression, you expect a linear model. There’s not much that can “go wrong”, unless you choose parameters unwisely. And if you do choose parameters unwisely, then there are common and recognized diagnostics and prescriptions for you to follow to either fix them, or move to another modeling technique. The work cycle in Statistics and Machine Learning is essentially:
- think about your problem, and look at your data, and establish goals
- develop a model structure (classifier or regression, over which variables)
- apply the simplest tool that could possibly produce that sort of model (go to 3 if this fails)
- check the resulting model’s goodness of fit and other quality measures (go to 2 or 3 if this fails)
This framework applies, with only nominal changes, whether you’re using linear regression or deep neural networks, support vector machines or k-nearest neighbor classifiers. The choice of tool depends primarily on the sort of model you have designed, and the success of the tool’s use depends on the structure of your data and the nature of that particular model.
The general point I’m making is this: When you use a Machine Learning tool, you are fitting parameters to a specific model.
You might find it odd that I’ve bothered to write this out. It seems so trivial and ubiquitous that it goes without saying. It’s as if I were describing the way a cabinetmaker would approach building a piece of furniture: she would first look over the design, and then (given some mastery of her tools and material resources) she would apply those tools to those resources; when a particular tool failed to suit the particular component task she was working on, then she’d find a better tool. End of story.
My point here is to emphasize that the fundamental stance of either a practical statistician or a cabinetmaker is to complete the design. There may well be obstacles and unexpected changes as things develop along the path, and the design may need to be adapted somewhat. But there will either be a cupboard or a regression model of patient survival likelihood in response to treatment in the end. She doesn’t want to invent some new kind of furniture that can hold butter and socks, she doesn’t want to explore all of the many furniture-like things that can be built out of this particular wood, she doesn’t want to know about all the nonlinear models that fit her patient dataset… she just wants to make the thing and move as quickly as possible to using that thing.
GP, and especially the small part of the discipline we refer to as “symbolic regression”1, shares a long parallel intellectual history with Machine Learning. Both traditions arose in the mid-20th century Artificial Intelligence community, and for a long time (on the order of the half-life of a human being) they couldn’t be easily distinguished. There is also a historical relationship by way of the metaheuristics community, and their overlap with Machine Learning, which is why we see phrases like “Neural and Evolutionary Computing” in the technical literature. If you ask most GP folks, they’ll often self-identify as doing a sort of Machine Learning, probably because the metaheuristics association has been so fruitful.
Machine Learning provides tools for fitting models. Metaheuristics are algorithms for fitting models. A particular model may have many parameters, and those parameters may even be assigned non-numerical types, but with few exceptions these tools are intended to assign good numbers to the coefficients in one particular model. The most effective Machine Learning tools and metaheuristics do this reliably and efficiently.
By “one model” I mean something like “one algebraic relationship”: \(y=\beta_0 + \beta_1 x^1 + \beta_2 x^2 + \beta_3 x^3 \dots \beta_m x^m\) is a model of some response \(y\) in relation to variables \(\{x_1,x_2,\dots,x_m\}\). When you apply Machine Learning, you’re doing so in order to find some really good numbers to use as those \(\beta_i\) values… and hopefully not too many of them all at once.
Symbolic regression also fits coefficient values in models. But this only happens at the same time the algorithm is exploring the space of models. Totally different. The fact that symbolic regression does this little bit of coefficient-fitting is probably the thing that trips most people up: they see GP and symbolic regression as a sort of “generalization” of traditional coefficient-focused numerical optimization. I’ve literally heard people, in modern times, say things like, “Not only are we able to fit models, but with GP we’re also exploring alternative models!”
This is backwards, and it leads to disappointment in many cases, both among practitioners and their customers. The truth of the matter is much more like this:
We are exploring the unbounded collection of all possible models, a vast and sprawling power set you can’t even visualize. To be able to compare one model to another, we need to do at least a little bit of optimization on the coefficients of both. But seriously, we’re not thinking too hard about that. This is fundamentally about the models, not the numbers. The more similar two alternative models are in their behavior, the more refinement we’ll need to do on the coefficients to differentiate between them.
Where Machine Learning is looking for the numbers to plug into \(y=\beta_0 + \beta_1 x^1 + \beta_2 x^2 + \beta_3 x^3 \dots \beta_m x^m\) so some performance measure is minimized, symbolic regression is looking through something like all algebraic functions over \(\{x_1, x_2, \dots x_m\}\), using multiplication, addition, subtraction and division. See the difference? It’s really deeply different.
There is a more fundamental difference: In the end of a Machine Learning process, a single “best” set of coefficients is produced. When done properly, symbolic regression will produce a collection of models, each of which has its own, contextually-appropriate coefficients. This is in part because the typical symbolic regression algorithm will be population-based, but on a deeper level we’ll explore below it’s because you should never have been led to expect a single “best” answer from any symbolic regression process.
Furthermore, whenever you see some particular numerical assignment for a particular coefficient of a GP model, please realize that the value should be “read” in a very different way from a similar coefficient in an optimized Machine Learning model. That particular value for that particular coefficient in an evolved model is only present insofar as it was able to discern contingent differences between models in the course of that particular search. The models arose within a particular, finite collection of alternatives we call a “population”, which existed only ephemerally in a particular, contingent state of search we call a “generation”.
The presence of a particular coefficient you find set to “5” in a model produced by symbolic regression is no more meaningful than the observation that you can type most effectively when you have all five fingers on both hands. The evolution of vertebrate limbs is not about the optimization of keyboard layouts. The presence of a particular numerical value in symbolic regression is not about the global best “solution”. It’s a consequence of a long and complex process of exploitation of partial solutions in context, coupled with exploration of alternative solutions—also in context. One particular thing can only be better than another in the moment.
Look back at my numbered list of “steps” in a project, above. In traditional Statistical and Machine Learning, the human practitioner is the sole source of novel models. Numerical optimization as it’s embodied in ML tools is useful for fitting those models, but it does not “explore” the possibilities of other models—except insofar as an outcome might suggest to a skilled practitioner, through experience and habit, ways in which this particular model structure might be badly-suited to her goals. Machine Learning tools are not there to “change the model”, just to fit it as best they can. The human does that work.
Here’s the problem: Because of the long overlapping history of symbolic regression and those other model-fitting methods, plus the strong tendency in non-specialist users of model-fitting tools to “just want the right answer”, most often people will use symbolic regression to produce a single “answer”.
That is a Bad Idea. When it happens, it will lead to confusion and frustration for the user (the researcher, the scientist, the engineer, the manager). Especially when they assume that this particular model produced by symbolic regression and labeled “best” exists in the same sort of warranted way that an ML result is the “best” assignment of numerical coefficients.
Symbolic regression systems that produce one “answer” are just badly designed… but it’s a common mistake. In some cases, GP researchers and trainers will tell you to run such malformed one-best-answer tools “many times”, to run “replicates” in order to create an “ensemble” of alternative models. But they don’t always say it, or if they do then they don’t always say it often enough. And we’re human, and it’s complicated, and so when we write software we don’t always have the development skills needed to build code that implicitly supports the notion of “many answers”. And just as in the case of regular old boring p-value abusing non-professional research statistics, many users only want to “know the right answer”—not a whole bunch of answers, not some hedge that says “maybe this”, just the right answer dammit why aren’t you listening to me? So they can get on with their work.
Besides, what does “a whole bunch of answers” even mean?
ParetoGP: Symbolic regression made useful
Suppose you need to buy a car. You are provided with a collection of car data, in a table, that includes the name of the car, the color, the cost, the power, the safety, and the resale value.
Which car do you pick?
Let’s focus on two things: cost and safety. I don’t know about your personal criteria, but in my case I want to pay as little as possible, and I also want to expose myself to as little danger of dying in a wreck if I sneeze at the wrong moment. Because I’m not very smart, especially when visualizing high-dimensional manifolds, I prefer to think of minimizing things, so let’s say I want to find the car that minimizes cost and sneeze danger.
I’m probably not going to startle you when I say that there is a trade-off between these two aspects of cars, at least as of this writing: Cheap cars tend to break more easily when you sneeze or bump into objects or drive in a high wind; all the most sneeze-resistant cars tend to have a lot more engineering and materials costs to protect the driver and passengers and are therefore more expensive.
Here, let me draw you a cartoon of how these numbers might look:
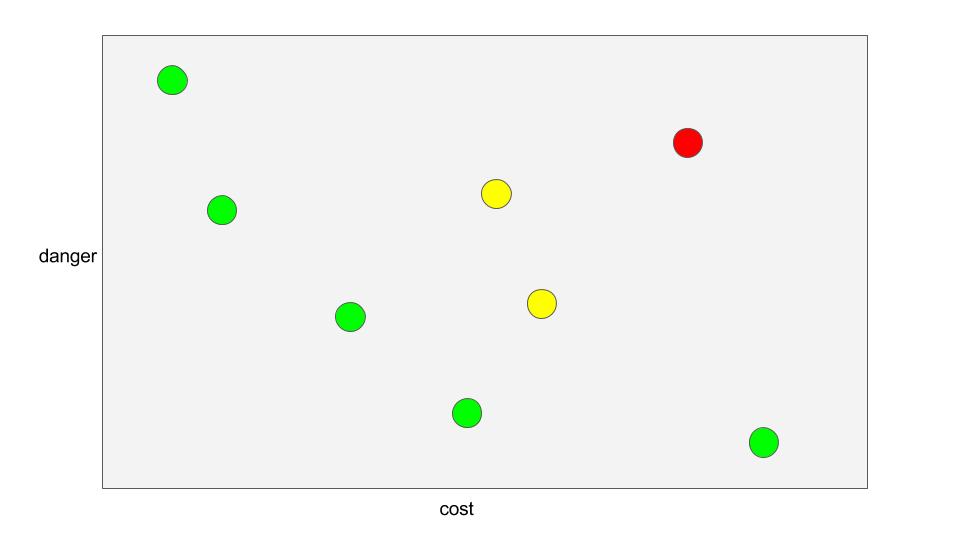
I want the cheapest car, which I guess is the one closest to the origin on the x-axis. I also want the safest car, which I suppose is the one closest to the origin on the y-axis. Now, looking over the collection of cars here, I can definitely see that some are simultaneously cheaper and safer than others. The one over in the top right (colored red) is pretty bad on both counts; I will infer from this that there’s something else that permits it to exist at all (maybe fuel efficiency? style?) but which we’re not taking into account.
The five cars colored green (and towards the left and bottom of this “cloud” of eight) are such that no other car is closer to the origin “in both directions”. For the two yellow points in the middle, and the red one at the upper right, at least one other car exists which is located down and to the left of it (when projected onto this space).
We say the red and yellow cases are dominated by at least one other case, and the green ones towards the lower left are non-dominated. One case dominates another when it is at least as good on all criteria, and also strictly better on at least one criterion. We also say that the non-dominated cases lie on the “Pareto front” or “frontier”.
ParetoGP is an elegant and powerful approach to symbolic regression that takes advantage of this same sort of multi-objective relationship, but between evolved models rather than cars. It was developed primarily by Guido Smits, Mark Kotanchek, and Katya Vladislavleva and their colleagues in the first decade of this century, and I’m going to explain a small part of the huge pile of important engineering and scientific work it represents because it’s that important. A reasonably good bibliography appears on the Evolved Analytics website, which is where most of them work now. But the original research has been published in several Proceedings Volumes of major evolutionary algorithms conferences and workshops, so be sure to look around.
Here’s the key: Whenever you use symbolic regression correctly—to explore the possibilities of modeling data rather than identifying a single “best” fit model—what you want is an accurate model to fit your data, which is also a parsimonious one. The simpler a model is (structurally speaking), the less accurate it will be: the zero-order polynomial \(y=\beta_0\) is super parsimonious, but it doesn’t explain a lot of the… you know, “up and down parts” of your data. On the other end, there’s going to be some polynomial, somewhere up there of an order about equal to the size of your dataset, which will pass through every point perfectly. Loads of wiggling, but not so much parsimony; you might be better to use the data itself as the model, rather than some complicated polynomial relation. A lookup table would do the same job.
Even if you really want to have only one model in the end, the one you pick should probably fall somewhere in between those extremes. A Goldilocks model. When using traditional Machine Learning approaches, the human practitioner will usually start off trying to fit a simple, relatively parsimonious model. Then, if and when that doesn’t work out, they will consciously expand the prospects to include more complex model forms: higher-order polynomial terms, interaction terms, more hidden variables, that sort of stuff.
In GP generally and in symbolic regression in particular, all of these models are in play at once. There is no “start with the simpler ones”. And if by some chance you’re the sort of person who wants to chime in here and say, “Well, it might be helpful…”: no, I promise you it is not.2 Regardless of our representation for GP—S-expression trees, or linear genomes, or grammatical seeds, or Cartesian jigsaw puzzles—any useful and interesting symbolic regression problem will involve a variety of structurally different models all being present simultaneously. It’s part of any population-based algorithm… and might even be definitional if you think hard enough about it.
Some of those diverse models will be smaller and less accurate, some will be larger and more accurate. If you were doing Machine Learning, and were “merely” refining a particular structural model’s coefficients to minimize some measure of prediction error, you’d be in trouble. But you’re not. As long as you’re thinking about it correctly, the very reason you’re using symbolic regression is to explore models of many types which more or less fit your data in unexpected ways, not to refine one model to fit as closely as possible.
There’s something important I want you to think about now, though I can’t do it justice in this limited space of a few thousand words: Some human being must always make a decision. Some particular thing happens, some particular purchase has to be made, some particular equation has to be solved, some particular model must be considered “right” for the moment at least. This is true whether you’re guessing on the basis of your “gut instinct”, deriving that model on the basis of the rational Vulcan machinery of first principles, discovering it by an iterative statistical exploratory approach in which you try the simple thing and only look farther when that model displays symptoms of being over-simple, or use symbolic regression but just “run it a bunch of times”, or (when you’re smart) you use something like multiobjective GP methods like ParetoGP.
Somebody always has to pick. The difference among these choices is not in the nature of the decision made, but in the degree of exploratory work and numerical insight you bring to bear before making that decision. If you guess, I’m going to count that as “no insight”. If you derive your model from first principles, then (because Science) no matter how smart you are I suspect there might be surprises in store for you when more empirical measurements are made available. If you use (only) the traditional statistical methodology, then you have a good chance to make some forays into the edges of the “combinatorial jungle”… but unless you are an extraordinary Statistician who is also infused with a manic fervor, I cannot imagine you will ever consider any of the weird-ass models symbolic regression will explore. The nature of your research program will have decided, to some extent, for you: simply by blocking you from ever considering many or most of the potentially interesting models in the world.
But we are here talking about symbolic regression because our goal is to explore. Symbolic regression provides a unique tool for that. But only as long as you manage your expectations mindfully, and explicitly.
That’s what ParetoGP is all about.
Review: boring old single-objective symbolic regression
I will assume you’re familiar with the general principles of symbolic regression algorithms, but in case you’ve slipped in without the background let me fill them in as a sketch:
The set of possible answers
We establish a language which describes an open-ended set of structural models we’re willing to consider. This language includes the variables we think might be of interest, the family of constants we want to consider, and all the functional and algorithmic relations between those elements we’re thinking of exploring. In symbolic regression problems, you will often think of these as independent variables and response variables (which are measurements you’re seeking to explain), numerical constants, and arithmetic functions.
Let me carry on using the example I started developing in the last episode. The independent variables here are x1, x2 and x3. I’ll use the simplest (and most common) suite of functions and constants: \(\{+, \times, \div, -\}\), and ephemeral random constants in the range \([-1000.0,1000.0]\).3
Some guesses
We construct some finite number of guesses. These are (technically) words in the language we’ve designed. In practice they’re also going to be random words; thus the name I prefer, “guess”. In the case of symbolic regression, these will typically be random arithmetic expressions over the set of independent variables, with some randomly-assigned constants and coefficients thrown in as well.
Now this set of all possible words in this language has an infinite number of elements. It has a lot of things that look like \((x_1 + 3 x_2 - 1.9 x_3)\), but it also includes things like \((9.2)\) (a constant) and \((10^{921} x_1^{75} - 10^{-813} x_3^{-298})\) and
\[18.231 + \cfrac{1}{x_1 + \cfrac{1}{x_2 + \cfrac{1}{x_3 + \cfrac{1}{(x_1 * x_2 - 7.777*x_3)} }}}\]and of course a lot of things way more complicated and weird than that.
But we are guessing at this point, and so we will use some arbitrary and admittedly ad hoc mechanism to pick “reasonable” numbers for constants, and “reasonable” numbers of terms, and rely on the rest of the algorithm to make it sensible as we go.
Rubrics and assigning scores
Now in all forms of symbolic regression, whether it’s the boring old single-objective flavor or the more appropriate and performative ParetoGP variety, we want to find models that return values as close as possible to the target values in our training data. Let’s follow tradition (but not too closely), and use as our aggregate rubric the sum of absolute errors over the training cases. That is, for each model we are comparing, and for every training case in the data we’ve observed, we will assign x1, x2 and x3, calculate the resulting y result, and compare that with the recorded target.
In the heavy-handed system I outlined last time, you’ll recall that I insisted on something weird. I will say that there is one simple error rubric for each training case, the score of which is the absolute deviation of the observed and expected value for that one case. In addition, we’ll define a secondary rubric over those simple ones, which is simply their sum over all training cases.
Here’s the data I mentioned last time
x1   x2   x3    y
------------------
 3    7   2.0   9
-2    7   2.0   99
 1    8   2.0   999
 5    9   2.0   99
 4   -1   9.7   9
...
When I score the guesses I’ve built, each will (by construction) return a value for y for any assignment of x1, x2 and x3. Except for some edge cases, that is. For example, for one of the guesses I mentioned above, \((x_1 + 3 x_2 - 1.9 x_3)\), the values of \(\hat{y}\) (observed y) are 20.2, 15.2, 21.2, 30.0 and so on. The errors are thus (assuming I can do math today)
x1   x2   x3    y    y-observed  |diff|
----------------------------------------
 3    7   2.0   9        20.2      11.2
-2    7   2.0   99       15.2      83.8
 1    8   2.0   999      21.2     977.8
 5    9   2.0   99       30.0      69.0
 4   -1   9.7   9        12.64      3.64
...                      ...       ...
Only when I’ve measured all the simple error scores can I calculate the aggregate secondary score of interest: the total absolute error.
Making babies
Free advice: The “evolutionary” part of symbolic regression is only historically inspired by a badly-understood dream of real biological evolution, and that dream happened more than three decades ago. Don’t get distracted by the metaphors, and don’t get sucked into believing you’ve gleaned insights into real biology by the algorithms we use to manipulate abstract algebraic formalizations.
One of the most important reasons for this advice is that we aren’t even trying to “emulate” natural selection, we’re doing something that’s far closer to selective breeding. Seriously, don’t even start with the “natural selection” stuff, OK?
In any case, there are so many particular Secret Family Recipe martial arts schools of search operators in GP, like mutation and crossover and selection—don’t get me started on selection—that it’s not worth going into details here. The big picture is pretty simple: We are going to make a bunch of variations on our initial guesses by changing and recombining them randomly, and we are going to select those with better scores. Or (because like I said, there are as many approaches as there are curry recipes) we are going to select the guesses with better scores, and use those to create variations by random changes and recombining parts. Or maybe we’ll do both, with some probability. Or we might use hill-climbing, or simulated annealing, or gradient descent.
It doesn’t matter.
What we want to do is start with a “population” of guesses, and by applying some Secret Family Recipe collection of seasonings and algorithmic transformations, end up with some new “population” of answers. And then do it all again, and again, and so forth, emphasizing the aspects of “better” answers, introducing beneficial changes that reinforce and enhance those “better” aspects, and discarding the ones that seem to be wasting our time unproductively.
Then a miracle occurs…
At some point we will notice that our measurements of “betterness” of the many answers we’re constructing have gotten good enough to satisfy our needs. Or they’ve stopped getting better, and we want to pause and do some exploring so we can understand why things have stalled. Or we get bored. Or the heat death of the universe has occurred.
One or more of those. But hopefully one of the first two.
Now, since you were paying attention, you’ll know that if the Secret Family Recipe we’re using to manage this exploratory project is badly written, it will return only a single “best” result. If that’s the case, then do it all again, many times, until you obtain an ensemble of models that are diverse and explain your data in different ways.
This applies even if the Secret Family Recipe algorithm you’ve downloaded or written yourself is very slow. You don’t want one model. If you did, you shouldn’t have been using symbolic regression in any case, and should instead have been using some quick, optimized Machine Learning coefficient search method to fit that model to your data.
So if your recipe only produces a single “result” model, do it many times and get many models. Or… here’s a thought: Change the bad Secret Family Recipe you’re using to be a better one, one that automatically produces multiple good models, every time you run it. In other words, use a ParetoGP algorithm.
What makes it “ParetoGP”?
One simple change. Remember above that I said that as part of our Secret Family Recipe for symbolic regression, we select models that are better?
If you’ve only ever been exposed to traditional Machine Learning, or badly-written symbolic regression, you probably think that means you should favor models that have lower error. But you’d be only half right, because I already told you the other thing you honestly need to be concerned about in symbolic regression projects: model complexity.
The fundamental difference between symbolic regression with ParetoGP and boring old single-objective GP is this: Whenever we compare two models, we don’t pick the one with the lower error. We pick the one that is nondominated with respect to the other, over both error and complexity.
Now “model complexity” is itself another type of Secret Family Recipe. You can be empirical and ad hoc and say (like I often do) that a model’s “complexity” is proportional to the number of characters we need to print it. Or you can get all theoretical and count terms in the formal language representation, or you could look at the mathematical properties of the response function (the number of peaks, the number of Fourier modes, the wavelet compressed size of it). Whatever.
You’re the one who’s running the project. You should have a good sense of whether one model is “more complex” than another. What you need to do is automate that insight, and use that as a second objective in the same search you would normally do in a typical “optimization” of error.
It’s really not complicated. The most complicated aspect of the change, aside from implementing the momentarily tricky logic of the formal comparison I’ve spelled out above—that one case dominates another if it is no worse on any objective, and also better on at least one—is dealing with ties. When you have two cases and are comparing them on the basis of a single objective, the only way you will ever end up with neither dominating the other is if they have literally tied scores. But when you have two objectives, as we do here, then two cases “tie” (neither one dominates the other) whenever they’re not “down and to the left” on the cartoon I showed above.
That is, assuming (as you should) that you’re minimizing both error and complexity of models, it’s just more likely that you’ll end up with one having more error and less complexity, and the other having more complexity and less error. Just because of the extra dimensions of comparison. As you can see in my cartoon above, five of eight cases are non-dominated.
That said, there’s often a philosophical stumbling block for many people: the sense of helplessness when faced with two models that are mutually non-dominating. We are so used to single-objective scalar comparisons in our work, that many smart people I know waste time trying to concoct a way of “collapsing” the two objectives down into one scalar “score”.
Don’t do that. Live with this. It’s more realistic, anyway. You just need to decide how to cope.
One way to cope, if you really have to do so, is to consider models “better” when they are closer to the origin. That is, if you know the minimum error (hopefully 0.0) and complexity (probably something like 0.0), then Smits and Vladislavleva and the rest have used the “elbow” region of the Pareto frontier as an approximation.
But… meh. Do that when you can’t stand it the other way. Keep it in mind, but don’t rush past the real multiobjective search.
What this gets you
First of all, ParetoGP side-steps that Very Bad Badness I’ve been complaining about in naive symbolic regression systems: It will always produce a collection of models, not just one “best”. Some will be simple, some will be complicated.
That in itself should be enough reason to immediately stop using the bad old way. But there are a number of other “problems” GP is prone to exhibit, and some of those also go away or are greatly improved by the simple change ParetoGP relies on.
Drift
There is a long-standing tension in the field of evolutionary metaheuristics between wanting to get the good answers, and wanting to have diverse answers. There are many facets to this “problem” (or, rather, trade-off), and no doubt it’s been discovered independently by almost everybody who’s ever played with evolutionary algorithms. While there are almost as many solutions as there are practitioners, the basic problem is relatively simple to describe: in any randomly-constructed sample of “genomes” (answers, for us), mixing and matching genes from those answers at random to make new ones will, over time, tend to lose genes. Even without evolutionary selection pressures (as we use the term in the field), you’ll end up losing genes over time. It’s just plain probability theory.
The population genetics term for the process is genetic drift, though of course there are some deep differences between the biological situation and the artificial “genomes” in GP. When you superimpose the inherent loss of genetic material caused by selection on top of it, you’re going to lose diversity in a GP system.
As I said, there are many “fixes” in the literature. Strangely, most seem to involve adding additional objectives, as we do in ParetoGP.
In Age-Layered Population Structure (ALPS) methods, you keep track of the age of every answer in the population—that is, how long beforehand it was “born”. Then you minimize both the error and the age of answers when you select. If two answers have the same error measure, the younger one is preferred; if two answers have the same age, the more accurate is preferred.
In Behavioral Crowding methods (and I feel I have the name wrong for these, so this might change), you keep track of the behavior of every answer in the population. Think of this as a vector of the simple rubric scores we collect in my scheme: a vector of the \(\hat{y}\) values, one entry for each training case in a canonical order. When we select answers, we use their error, and also the number of other answers with some radius \(r\) in this high-dimensional vector space. Think of this “number of neighbors within some distance” as a sort of crowdedness, and we can say we are simultaneously minimizing crowdedness and similarity between answers.
The same sort of effect happens in ParetoGP. When we select on the basis of error and the complexity of models, we’re offsetting the inherent tendency of genetic drift to bring the population towards a single genome. I won’t go into the details here, because some of this argument relies on indirect probability effects. But it just kinda works.
Bloat
As I mentioned in the prior episode, one of the long-standing bugbears of GP research has been the problem of “bloat”. Bloat is another side-effect of the stochastic branching process we’re undertaking in GP: When you have a bunch of trees, and you chop up the trees into parts and you stick the parts on other parts, some of those trees will get bigger and some will get smaller.
Well, duh, you say. OK, fair enough. But at least in the case of symbolic regression problems, these “trees” I’m talking about are algebraic expressions. And it turns out that there are plenty of ways to make ever-more-complicated algebraic expressions that evaluate to the same value. For instance, while you or I might write 2+2 as our canonical snide comment about something obvious, symbolic regression is not bound by our puny hyoo-man standards of “elegance”, and it is as likely to write 6*(2+1+0+0+(4x-19x^2)*(3-2-1))-(2*7) and say it’s close enough.
In other words, bloat is the combined tendency of probability theory (which tends to mix stuff up so it gets bigger) and single-objective selection (which can find many things that provide the same score, but doesn’t care how) to make increasingly large portions of evolving answers into “non-coding genes”.
As with the problem of diversity, there are many solutions to this problem. One of the most common is that of algebraic simplification, but there’s a problem in this. If you simplify the genomes of evolving answers, you are throwing away the potential raw material from which novel solutions might arise in the future, and basically accelerating genetic drift. And if you use algebraic methods to simplify the “user’s view” of the answers without simplifying them genetically, you’re wasting a lot of your computing power by ignoring the fact that 6*(2+1+0+0+(4x-19x^2)*(3-2-1))-(2*7) really is just 4.
But guess what? One of the side-effects of a simple ParetoGP approach in which you select simultaneously for low error and low complexity is that you drive out much of the “bloat”. Again, as with the diversity problem, there are complicated details of probability theory tucked in there, and those details interact with those of diversity and selection and population structure and stochastic branching processes. Again: it really just kinda works.
Feature discovery
One of the things we often tout about symbolic regression is its “human readability”. I tend to side with the Machine Learning (and Deep Learning) people on this, when they hear this concern voiced about their modeling methods, and say, “Who cares, as long as it works?” Because Machine Learning is a tool, and a tool is defined in a real sense only on the basis of the work it permits.
That said, symbolic regression does make “human-readable” equations. Of a sort; certainly we can all look at the words and symbols and numbers and for any local patch we sort of know what is going on. But see the previous section on “bloat” for one reason why I’m hedging this.
There is also a more treacherous and nuanced problem with the “human readability” of evolved symbolic expressions, and that’s their tendency to be weird and totally crazy fucked-up looking. Tell a stock trader you’re evolving trading rules, and they might be excited; show one of them a rule that trades on \(sin(\textrm{AT&T})\) and they will crumple it up and throw it at your head. Tell a doctor you’re evolving diagnostic tools, and they might be excited; show them a rule that triggers an emergency room visit on \(sin(sin(sin(sin(sin(\textrm{systolic_bp})))))\) and… crumpled and thrown out. Tell a chemical engineer that you’re evolving controllers for a production facility, then show her a rule that tracks on \(\sqrt[18]{\textrm{[NaCl]}}\) and almost certainly they will wonder how they can crumple the paper up even more. And so on.
You get the picture. The problem is not really that of “human readability”, but rather of human reasonability, and it is not limited to symbolic regression by any means. The broader technical concern is that of feature selection, and there is a long and diverse history of this concept in many fields.
Now Smits and Kotanchek and Kordon and Vladislavleva developed the ParetoGP approach in a chemical engineering environment, so they know about this problem, and their solution is ingenious and elegant. Let me paraphrase a lot of excellent work they’ve done over many years:
When we use the “raw data” in symbolic regression, just by random chance the process will tend to combine those variables in nonsensical ways, because of the relative numerical equivalence of many forms of simple function. When a single-objective GP run is performed, the resulting “best” model will often contain this sort of unreasonable components.
By using ParetoGP to construct many alternative models simultaneously, we find an ensemble of simple but relatively inaccurate models, and also more complex but accurate ones. Further, if we train ParetoGP many times on the same dataset, we gradually accumulate a library of models which are more-or-less mutually nondominated for both error and complexity.
By the very nature of algebraic mathematics, these models will each be more or less hierarchical (regardless of our representation scheme): At the lowest level, they are composed of constants and data variables. These are combined into small units by simple arithmetic functions into larger-scale modules of two or three variables each, and those in turn are combined into larger units, and so on up to entire model itself.
Given a sufficiently diverse library of models for a given dataset, we can gain insight into the relative importance of each “raw” variable on the outcome by examining the frequency with which each variable occurs in the entire collective library of fit models.
More importantly, we can discover useful algebraic transformations of the “raw” variables into more sensible and reasonable metavariables by examining the frequency with which first- and second-order modules appear in the library. For example, in a high-dimensional dataset, it may not be obvious until a library of models has been collected and examined that \((x_3*x_{91})\) and \((log(x_7))\) appear with high frequency in many models.
When these metavariables are vetted by domain experts, the prospect for realistic (and reasonable) models can be improved, by using metavariables in lieu of the “raw” data variables in further seaches. Indeed, in some cases the domain experts value the discovery of new metavariables at least as much as more complex models.
It’s an ingenious methodology (and you should read more about it if you’re interested). This sort of “pre-screening” for transformed variables is literally not possible with most traditional Machine Learning methods, because they don’t explore alternative model structures in the same way symbolic regression does. This is, ultimately, one of the killer apps of symbolic regression: the refinement of the language with which you are framing your questions.
And there’s more
I haven’t discussed the ways ParetoGP can inform design of experiments and choice of expensive sampling strategies, but that’s out there in at least two of the Genetic Programming Theory and Practice chapters from Kotanchek and Smits. I haven’t spent any time on Data Balancing, but there’s a load of excellent work by Katya Vladislavleva in her readable and inspiring PhD thesis [PDF]. And more.
Mark Kotanchek has produced a powerful commercial product called Data Modeler that implements much of what I’ve talked about in Mathematica. If nothing else, the description of the tools implemented there would be a suitable inspiration for many data scientists considering large-scale projects. Michael Schmidt’s thesis project turned commercial project, Eureqa, also uses a Pareto GP algorithm for symbolic regression at its core.
There aren’t any FOSS solutions I’m aware of at the moment… which might be enough to prod me into finishing my own some time soon. But the principles aren’t complicated, and the change one would need to make in any well-written and maintainable single-objective symbolic regression system is more or less trivial.
Verdict: Never rely on single-objective search for symbolic regression projects
Seriously. Just start from the first day with a plan to simultaneously minimize error and model complexity.
Be prepared to think about what “model complexity” means in your context: Is the the number of characters in the string representation of the model? The number of variables? The number of variables and constants and functions? The wall-clock time? The computational complexity? Something about nonlinearity or derivatives? Something about compressibility? Pick something and try it.
Be prepared to examine any sufficiently large dataset for metavariables, using the frequency techniques Kotanchek and Smits describe in their papers. Gather many models, by running ParetoGP many times on the data. Then examine the frequencies of the data variables, and the frequencies of the terms on some small scale, and look for patterns. Not only can those simple patterns be the most informative, but by using metavariables instead of raw ones in your symbolic regression searches thereafter, you can “herd” the results towards more reasonable behavior—always remember that “human readable” doesn’t mean reasonable very often.
There are many other things I’ll advise, but in future episodes and not here. I’ll suggest you think carefully about whether you really want to do symbolic regression, or something more akin to “real” genetic programming, with data structures that aren’t just numbers and bits. I’ll suggest you think about the performance space of your ensemble of models, and explore what that tells you about your training data. And absolutely without fail I will tell you to draw pictures. Lots and lots of pictures, of a sort that highlight the things you find valuable, and hide the useless “I did a thing” reporting most naive GP packages dump to STDOUT stream. You don’t want a thing heating up your computer counting from 1 to 1000… you want something that shows you what’s happening inside that hot computer.
But more on those another day.
-
Including the use of symbolic regression in developing classifiers, which is sort of self-evident but I recently heard people drawing the distinction so I wanted to be careful. ↩
-
You want to know why GP doesn’t start with simple linear models and work its way up from there, leveraging simplicity into complexity only when “necessary”? Because of combinatorial explosions. The number of moderately interesting and useful models once you get to even a small amount of complexity is vast, and if you start with simple models and “work up to” more complex ones, you are introducing an inherent bias due to sampling error and founder effects. In general, this is like Henry Ford’s old dictum about the Model T, “You can have any color you want as long as it’s black.” If you start by looking at all the simple models, and pick the best of those, then all the more complex models you will ever have time to explore within the lifetime of the universe will be the “best” simple model plus some extra stuff stuck on. In other words, you undermine the very point of expansive, exploratory search. So don’t. It’s a bad idea in almost every situation. ↩
-
Why that particular range of numbers? I have no idea. Nobody has any idea. There are probably smart ways to do that, but it’s just an example at the moment. We’ll come back to that another day. Hold that thought. And so forth. ↩